A smartphone can guide a driver through Cairo, help a hiker find a trail in Nepal, and allow scientists to track coastline change in Bangladesh. Those tasks seem very different, but they all depend on the same big idea: people can study Earth by using geographic tools to collect evidence and answer questions. Geography is not just about memorizing places. It is about figuring out why places are the way they are, how they change, and what might happen next.
Geographic inquiry is the process of asking questions about Earth, gathering information, and using that information to explain patterns. A geographer might ask: Why are some cities growing quickly? Where is farmland expanding? Which areas are most likely to flood? These questions matter because they affect transportation, farming, water supply, health, and safety.
In the Eastern Hemisphere, geographic inquiry helps us understand a huge variety of environments. This part of the world includes dry deserts in North Africa and Southwest Asia, monsoon regions in South Asia, high mountain systems such as the Himalayas, tropical forests in Southeast Asia, and crowded urban regions in East Asia. Because the region is so diverse, geographers need reliable tools to study it carefully.
Geographic inquiry means asking questions about places, gathering evidence, and using that evidence to explain patterns or make predictions. Geographic inference is a conclusion based on geographic evidence, such as maps, images, and data. Prediction in geography is an evidence-based statement about what is likely to happen in the future in a place or region.
Good geographic inquiry depends on evidence. Instead of guessing, researchers compare different sources. A map may show political boundaries. A satellite image may reveal vegetation or city growth. A field team may record exact locations with a GPS device. Population data may show how many people live in an area. When these sources are combined, they give a fuller picture than any one source alone.
Some of the most useful tools in geography are maps, globes, atlases, digital map layers, field notes, photographs, GPS devices, and satellite imagery. Each tool answers a different kind of question. A road map helps with routes. A topographic map shows elevation. A climate map shows long-term weather patterns. A satellite image reveals what Earth's surface looks like from above.
Another essential idea is location. Geographers often describe location using latitude and longitude. Latitude measures distance north or south of the Equator, while longitude measures distance east or west of the Prime Meridian. Together, these form a grid of coordinates that can pinpoint places on Earth with great accuracy.
Scale also matters. A small-scale map shows a large area, such as all of Africa, but not much detail. A large-scale map shows a smaller area, such as part of Tokyo, with much more detail. If a researcher studies traffic in a city neighborhood, a large-scale map is more useful. If the goal is to compare climate regions across Asia, a smaller-scale map may work better.
Remember that maps are models of reality, not reality itself. Every map leaves some things out. That is why geographers compare several sources before making strong conclusions.
Many modern geographic tools are digital. Computer-based mapping systems can place different kinds of information in layers. One layer might show rivers, another roads, another population density, and another elevation. Looking at these layers together helps researchers notice relationships, such as where settlements cluster near water or where steep slopes limit road building.
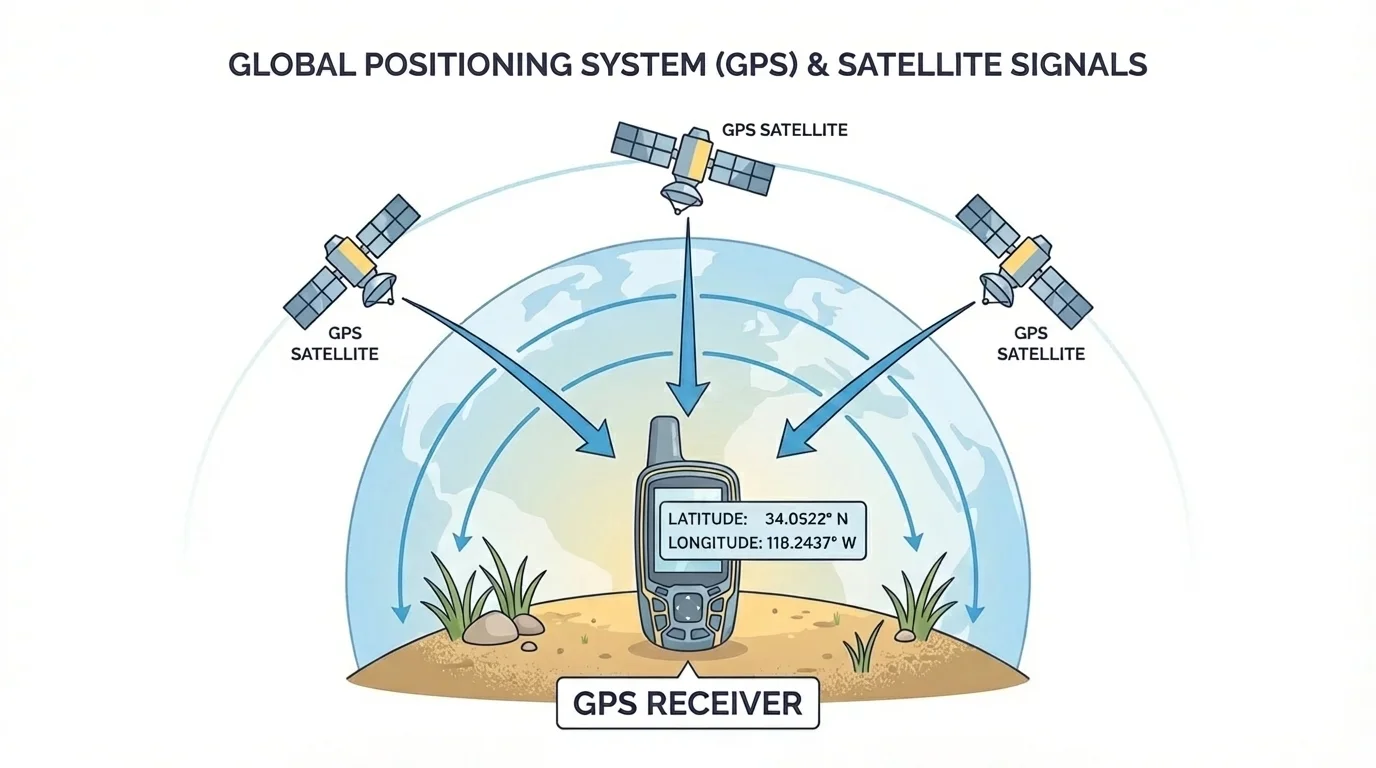
A GPS, or Global Positioning System, helps people find exact locations on Earth through the connection between satellites and a receiver on the ground. GPS is used in cars, phones, ships, airplanes, and scientific fieldwork. It allows researchers to collect location data accurately instead of relying only on estimates.
[Figure 1] GPS works by using signals from satellites orbiting Earth. A receiver, such as a phone or handheld GPS unit, reads signals from several satellites. From those signals, it calculates a location using latitude and longitude. The basic idea is that the receiver compares signal timing and determines where it is on Earth.
Geographers use GPS in many kinds of research. A team studying water pollution along a river in India can mark the exact coordinates of each sample site. A wildlife researcher in Kenya can record the paths of elephants fitted with tracking devices. A disaster response team in Türkiye can map damaged roads and blocked routes after an earthquake. In each case, GPS turns observations into precise geographic data.
GPS is powerful, but it is not perfect. Signals can be weakened by tall buildings, mountains, dense forests, or bad weather. A phone's location may be accurate within only a few meters rather than an exact point. That may be good enough for navigation, but scientific research often requires careful checking with additional tools.
Case example: Mapping wells in a village
A team is studying water access in a rural area of Sudan.
Step 1: The team visits each well and records its coordinates with a GPS device.
Step 2: The coordinates are placed on a digital map along with village locations.
Step 3: The team compares the well locations to settlement patterns and roads.
Step 4: They infer which neighborhoods are farthest from reliable water sources.
This information can help leaders decide where a new well would be most useful.
The value of GPS becomes even clearer when combined with other tools. Later, if the same wells are visible in aerial or satellite images, researchers can compare field data with surface patterns. That kind of comparison improves accuracy and helps explain what is happening in the landscape.
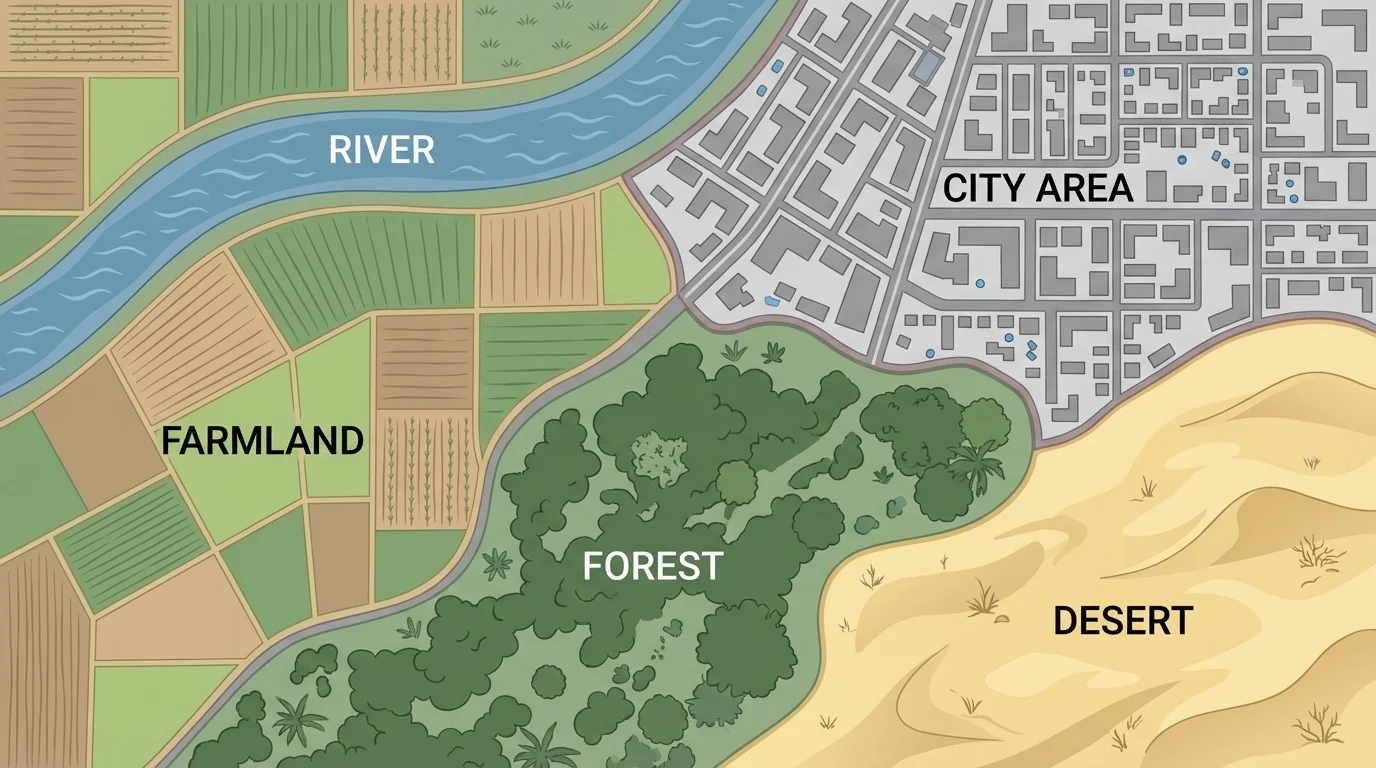
Remote sensing means collecting information about Earth from a distance, often with satellites or aircraft. One of the most important forms of remote sensing is satellite imagery. These images reveal patterns of land and water that may be difficult to see from the ground, and [Figure 2] displays how different land covers can be recognized by their shapes, colors, and textures.
Satellite images can show forests, farmland, rivers, coastlines, deserts, mountain snow, and urban areas. A city often appears as a dense patch of gray or white shapes and lines. Cropland may appear in regular patterns, such as squares or rectangles. A river may curve across a region as a long dark band. Sand dunes may appear as repeating wave-like shapes.
Geographers do more than simply look at satellite images. They interpret them. They ask what patterns mean. If a lake looks smaller in images from different years, that may suggest drought or heavy water use. If a city spreads into nearby farmland, that may indicate urban growth. If slopes in a mountain region show fewer trees over time, that may point to deforestation or land clearing.
Satellite imagery is especially useful in places that are large, remote, or difficult to reach. It helps scientists monitor the Arabian Desert, the Siberian landscape in Russia, the rainforests of Indonesia, and the islands of the Indian Ocean. Instead of visiting every square kilometer on the ground, researchers can study wide regions efficiently.
Some satellites pass over the same place again and again, which allows scientists to compare images over time and detect change. This makes satellites especially useful for studying floods, shrinking lakes, crop health, and fast-growing cities.
There are limits, though. Clouds can block the view. An image may be outdated. Some features are too small to identify clearly. Also, a satellite image does not automatically explain why something changed. It shows evidence, but geographers often need field observations, interviews, or climate data to understand the cause.
As we saw earlier with GPS and now with imagery, geographic tools are strongest when they work together. The land cover patterns in [Figure 2] help researchers separate farmland, settlement, water, and desert, but they still need local data to confirm their interpretations.
A strong geographic inference usually comes from comparing several sources. Suppose researchers want to know why a settlement has grown near a river in Pakistan. A map may show transportation routes. A satellite image may reveal expanding neighborhoods. GPS points may show new schools, wells, or clinics. Population data may show rapid growth. Together, these sources support a stronger conclusion than any single source by itself.
This process is a bit like solving a mystery. One clue is interesting, but several matching clues create confidence. If satellite imagery shows new roads and housing on the edge of a city, and census data shows population increase, it is reasonable to infer that urban expansion is occurring. If those new neighborhoods are near flat land and transport lines, a geographer may also infer why the city is growing in that direction.
Geographers also compare physical and human factors. Physical factors include landforms, rivers, climate, and soil. Human factors include trade, farming, technology, conflict, and government decisions. For example, a port city may grow because it has both a good natural harbor and a strong trade network. Geographic inquiry works best when it considers both kinds of factors together.
| Tool or Source | What It Shows Best | Possible Limitation |
|---|---|---|
| GPS | Exact location of field observations | Signal accuracy can vary |
| Satellite imagery | Surface patterns and change over time | Clouds or low detail may hide features |
| Political or physical map | Borders, landforms, and general spatial layout | May not show recent change |
| Population data | How many people live in an area | May be old or incomplete |
| Field observations | Local details and direct evidence | Usually cover a smaller area |
Table 1. Comparison of common geographic tools and the strengths and limits of each source.
[Figure 3] The Eastern Hemisphere contains many regions where geographic tools reveal important patterns across Africa and Asia, including the Nile Delta, the Sahel, the Himalayas, and the urban corridor of eastern China. These places are different, but each shows how geographers use evidence to study change.
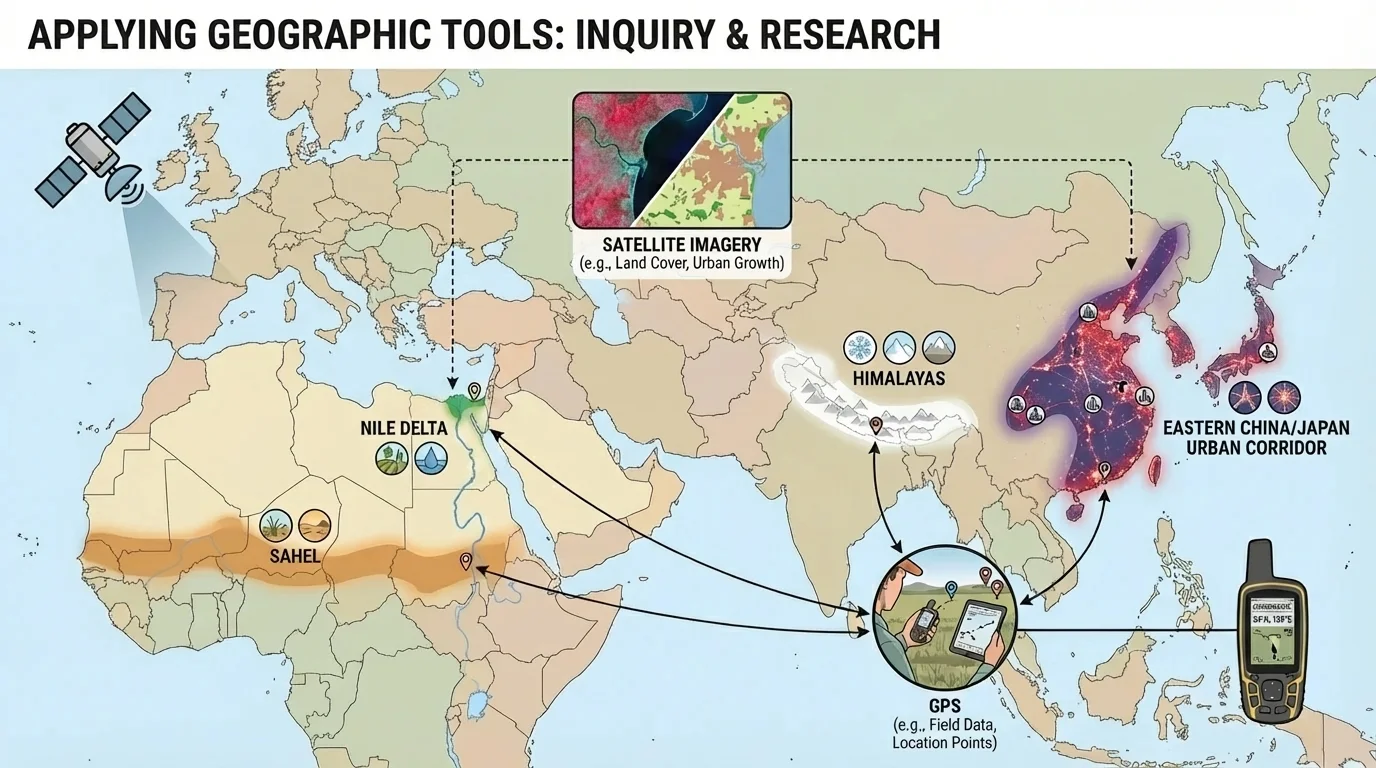
Nile Delta, Egypt: The Nile Delta is one of the most fertile regions in North Africa. Satellite imagery can show farmland, irrigation canals, and expanding urban areas near Cairo and Alexandria. If images from different years show more construction on former cropland, geographers may infer that urban growth is reducing farmland. GPS field data can confirm the exact locations of new roads or neighborhoods.
Sahel Region, Africa: The Sahel is a semi-dry belt south of the Sahara. Geographers use satellite imagery to monitor vegetation and bare ground. If images show less plant cover over time, that may suggest drought, overgrazing, or desertification. However, researchers must compare this with rainfall records and local observations before drawing firm conclusions.
Himalayas, South Asia: In the Himalayas, steep slopes, glaciers, and mountain rivers create hazards such as landslides and floods. GPS can mark trail routes, village sites, and damaged areas after storms. Satellite imagery can reveal snow cover, glacier retreat, and river changes. These tools help geographers infer which valleys may be at greater risk.
Eastern China: Some of the fastest urban growth in the world has happened in eastern China. Satellite images show cities spreading outward, while transportation maps reveal new highways, rail lines, and ports. From this evidence, geographers can infer links between transportation networks, industrial growth, and migration into urban areas.
Patterns and change over time
One of the most important ideas in geography is that places are not static. By comparing data from different dates, geographers can detect trends such as forest loss, wetland shrinkage, river movement, and city expansion. Time makes geographic tools even more powerful because it turns a single snapshot into a story of change.
These case studies show why location matters. The same tool can be used in many places, but the interpretation depends on local conditions. A dark area in one satellite image might be healthy forest, while a dark area in another could be deep water or a city shadow. Careful geographic inquiry always considers context.
When students look back at the highlighted regions in [Figure 3], they can see that the Eastern Hemisphere is not one uniform place. It includes connected regions with very different environments, economies, and risks, which is why geographic tools are so valuable.
Geographic tools are powerful, but they can also be misused or misunderstood. A map may be out of date. A GPS reading may be slightly off. A satellite image may be taken in a season that makes vegetation look very different. If researchers ignore these limits, they may make weak inferences.
There are also ethical issues. Exact location data can reveal sensitive information about people, wildlife, or important sites. For example, publishing precise coordinates of endangered animals could make poaching easier. Sharing detailed household location data could invade privacy. Responsible geographic research protects people and places while still using data carefully.
Another challenge is bias. Researchers may notice only the evidence that supports what they already believe. To avoid this, they should compare multiple sources, ask whether another explanation fits the data, and be willing to revise their conclusions.
"The map is not the territory."
— Alfred Korzybski
This statement reminds us that every map or image is only a representation. It can be useful and still be incomplete. Good geographers stay curious, careful, and willing to ask follow-up questions.
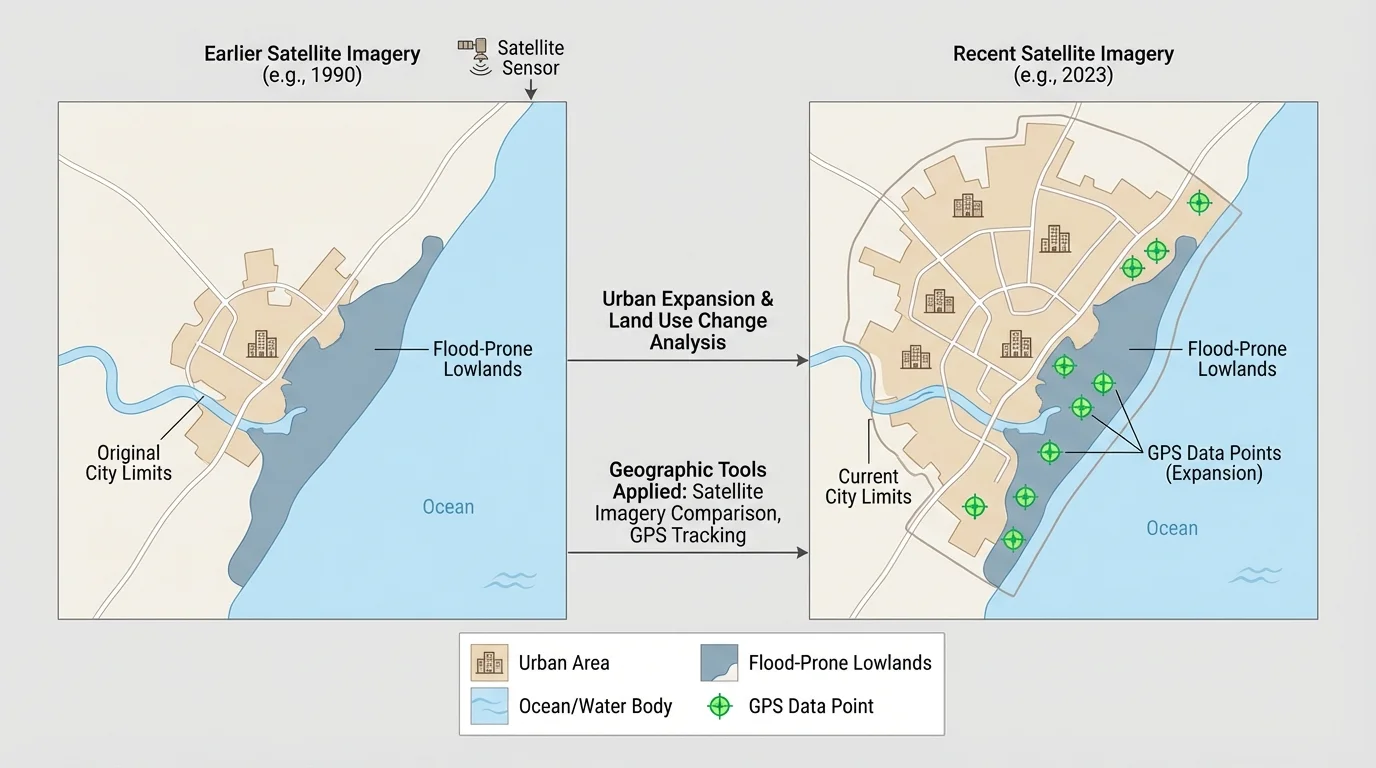
[Figure 4] Geographic research does not stop with describing what is happening now. It also helps us make predictions about what is likely to happen next. Evidence from maps, GPS data, and satellite images can reveal trends, including how urban expansion and flood risk can overlap in a coastal setting. Predictions are not wild guesses; they are based on patterns.
If a coastal city in Bangladesh keeps expanding into low-lying land, geographers may predict a higher flood risk for future neighborhoods. If satellite images show a shrinking lake in Central Asia over several years, researchers may predict water shortages for nearby communities. If GPS and imagery reveal road construction through a previously isolated area, geographers may predict increased trade, migration, or land use change.
Predictions are especially useful for planning. Governments can decide where to build roads, dams, schools, or flood defenses. Farmers can adjust crops based on rainfall and land condition patterns. Emergency teams can identify areas that may need evacuation routes or stronger infrastructure.
Case example: Predicting flood risk in a delta
Researchers are studying a low-lying delta region.
Step 1: Satellite images from several years show that the shoreline is changing and some wetlands are shrinking.
Step 2: GPS field points mark villages, roads, and embankments.
Step 3: Elevation maps show that some settlements are only slightly above sea level.
Step 4: The researchers infer that areas with low elevation and weak barriers face greater flood danger.
From this evidence, they predict that future storms could affect those settlements more severely unless protections improve.
Predictions must still be tested. A geographer may make a strong prediction and later discover new evidence that changes it. That is normal in research. The goal is not perfect certainty. The goal is the best possible conclusion based on the best available evidence.
By using GPS, satellite imagery, maps, field observations, and data together, geographers can investigate how places in the Eastern Hemisphere function, how they are changing, and what those changes may mean for the people who live there. The same skills used by professional researchers can also help students think more carefully about their own world: ask a question, gather evidence, compare sources, and build a reasoned conclusion.