Every day, people make decisions using geography without even noticing it. Weather apps predict storms, shipping companies choose routes across oceans, and city planners decide where new roads should go. None of that happens by guessing. It happens because people collect information about places, sort it carefully, and study patterns. That is exactly what geographers do when they use data to understand the world.
In the Eastern Hemisphere, these skills help explain why huge populations live in river valleys, why some regions depend on monsoon rains, why deserts have fewer settlements, and why certain coastal cities grow so quickly. Geography is not just about memorizing locations. It is about using evidence to answer questions such as: Why are people living here? What might happen next? Which areas face the greatest risks from drought, flooding, or overcrowding?
Geographic data is information connected to places and regions. It may describe climate, landforms, natural resources, population, transportation, farming, trade, or hazards. When geographers study this information, they look for patterns across space. They ask how the natural environment affects human activity and how humans change the environment in return.
For example, if a map shows that many large cities in East Asia are located near coasts or rivers, that pattern is not random. A geographer might infer that access to water, trade routes, and flat land helped those cities develop. If current data also shows fast population growth in those places, a geographer may predict that transportation systems, housing, and water supplies will face pressure in the future.
Geographic inference is a conclusion about a place or region based on evidence from maps, data, observations, and other sources.
Geographic prediction is a reasoned statement about what may happen in the future based on current geographic patterns and trends.
These two skills are connected. First, geographers study evidence and make an inference about why something is happening. Then, using the same data, they may predict what is likely to happen next.
Geographers use many types of data. Some data is quantitative data, which means it uses numbers. Examples include rainfall totals, population size, elevation, average temperature, and distance. Other data is qualitative data, which means it describes qualities or characteristics. Examples include whether land is urban or rural, whether vegetation is dense or sparse, or whether a government is stable or unstable.
They also use primary sources and secondary sources. A primary source provides firsthand or original information, such as a field observation, a survey, a photograph, or a satellite image. A secondary source explains or summarizes information from other sources, such as a textbook, article, or report.
Good geographic study usually combines several sources. A population map alone might show where people live, but it will not fully explain why. To answer that, a geographer might also use rainfall records, landform maps, transportation routes, and historical information.
Remember that a pattern is something that repeats or appears regularly. In geography, patterns might involve where people settle, where rainfall is highest, or where earthquakes happen most often.
Geographic tools include maps, globes, graphs, charts, satellite images, digital mapping systems, and tables of statistics. Each tool helps answer a different kind of question. A physical map emphasizes landforms, a climate graph shows temperature and precipitation, and a population-density map helps reveal where people are crowded together or spread far apart.
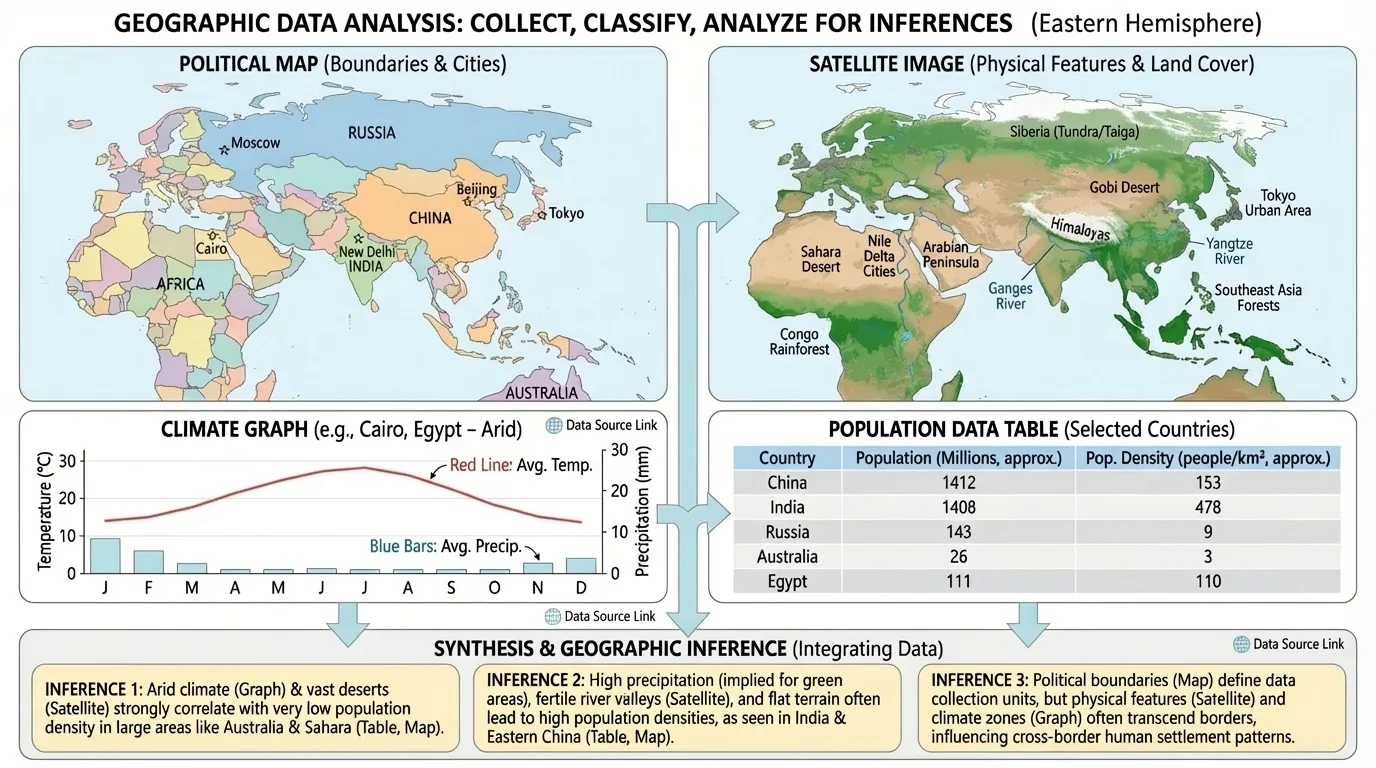
Geographers often combine several tools to understand one place, as [Figure 1] shows. A map may locate a region, a satellite image may reveal land cover, a climate graph may show seasonal rainfall, and a table of population data may explain how many people live there. Looking at only one source can lead to a weak conclusion, but using several sources builds a stronger explanation.
In the Eastern Hemisphere, geographers might collect information about the Sahel in Africa, the Ganges River basin in South Asia, or coastal China. They may use census reports to learn population totals, satellite images to examine farmland or cities, and weather records to study seasonal change. They may also use field observations, such as notes about soil, water, traffic, or housing.
Not all data is equally trustworthy. Reliable data usually comes from sources that are current, clearly measured, and carefully checked. If one map is very old, its borders, roads, or population information may no longer be accurate. If a survey includes only a small group, it may not represent the whole region. Geographers must always ask who collected the data, when it was collected, and how it was measured.
Scale matters too. A world map can show broad patterns, but it may hide local differences. A local map of one city may reveal details that disappear on a continental map. For example, a map of Africa might show the Sahara Desert as one giant dry region, but a more detailed map can reveal rivers, oases, and settlements within it.
Satellite images can help geographers measure changes over time, such as shrinking lakes, growing cities, and disappearing forests. This lets scientists compare one year to another instead of relying only on written descriptions.
Careful collection is the first step in geographic thinking. If the information is weak, then the inference and prediction built from it will also be weak.
Once data is collected, geographers sort it into useful groups. This process is called classification. Classification makes large amounts of information easier to understand. The same region can be grouped in more than one way.
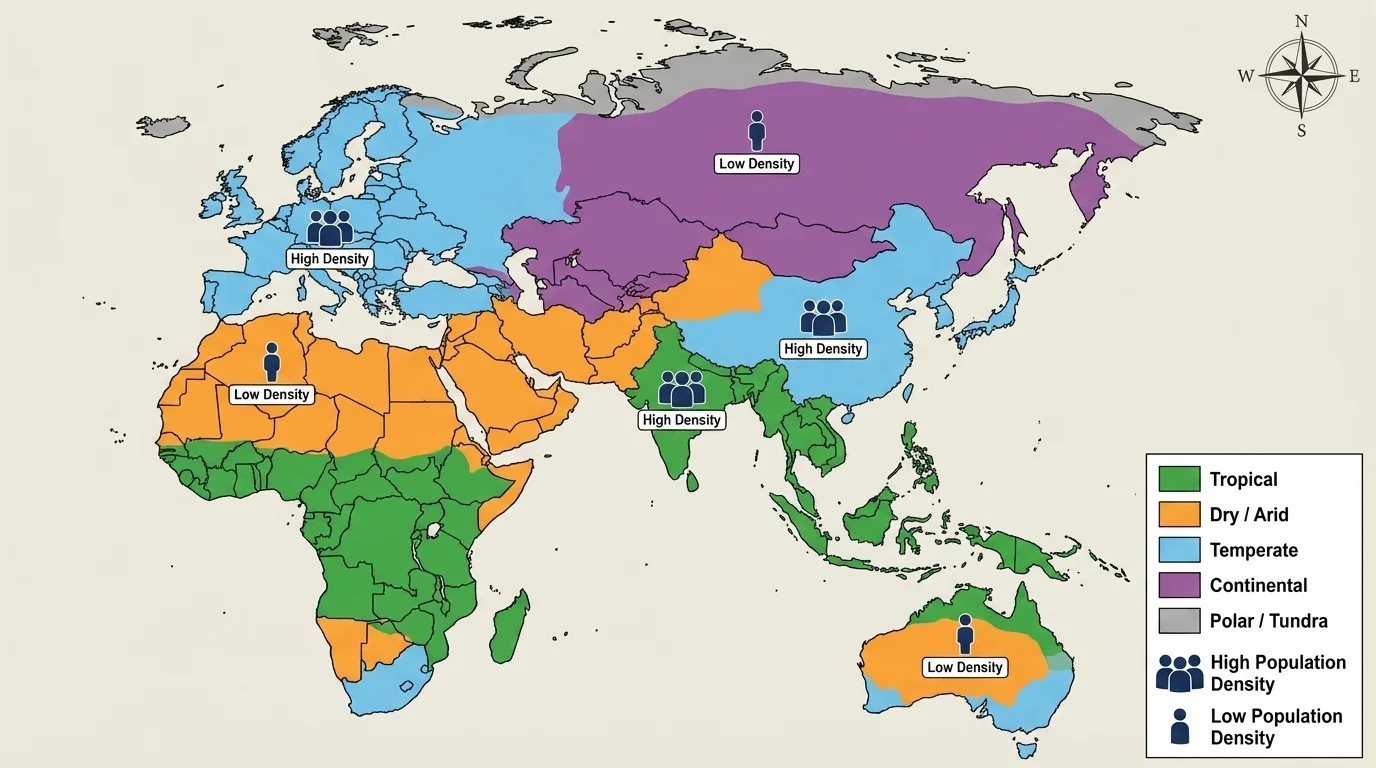
A geographer studying the Eastern Hemisphere might classify places by climate, such as tropical, arid, temperate, or polar, as [Figure 2] shows. The same places could also be classified by land use, such as farming, industry, transportation, or housing. They could be grouped by population density, by access to water, or by natural hazards like earthquakes and volcanoes.
Classification helps reveal relationships. If highly populated areas often occur near rivers, coasts, or fertile plains, that pattern becomes easier to notice once the data has been organized. If dry regions have fewer major cities, classification helps make that pattern clearer too.
Geographers often organize data into tables.
| Region | Main Data Type | Possible Classification | Possible Question |
|---|---|---|---|
| North Africa | Rainfall | Arid and semi-arid | Where can farming happen? |
| South Asia | Seasonal precipitation | Monsoon climate | How does rain affect crops and flooding? |
| East Asia | Population | High-density urban zones | Why are cities growing so fast? |
| Japan | Seismic activity | High earthquake risk | How should buildings be designed? |
Table 1. Examples of how geographic data can be classified to guide investigation in the Eastern Hemisphere.
Organizing data also helps geographers compare places. They can compare rainfall in India and Egypt, population density in Japan and Mongolia, or urban growth in China and Indonesia. Comparison is one of the fastest ways to notice geographic patterns.
Analyzing patterns is central to geographic study. To analyze data means to examine it closely and look for relationships, causes, and trends. Geographers ask questions such as: Where is this happening? Why here? Is it increasing, decreasing, or staying the same? How is one factor connected to another?
Some patterns are spatial, meaning they involve location. For example, major cities in the Eastern Hemisphere are often near rivers, coasts, or trade routes. Other patterns are based on time. For instance, a graph may show that a city's population has grown steadily over the last few decades. Some patterns combine space and time, such as a city expanding outward year after year.
Geographers also watch for relationships between natural and human factors. A mountain range may block moist winds and create a dry area on the other side. A fertile river valley may support dense farming populations. A coastline with good harbors may attract trade, industry, and large cities. These are not just facts to memorize; they are clues that help explain how places work.
Looking for relationships
Geographers often compare two or more kinds of data at the same time. For example, they may compare rainfall maps with crop maps, or elevation maps with settlement maps. If the two sets of information match in an important way, that may reveal a relationship worth explaining.
However, geographers must be careful. Just because two things happen in the same place does not always mean one causes the other. A good inference needs evidence from more than one source.
When geographers make a conclusion from data, they are making an inference. Inference uses evidence, not guessing. Climate data and wind direction, for example, help explain rainfall patterns in South Asia.
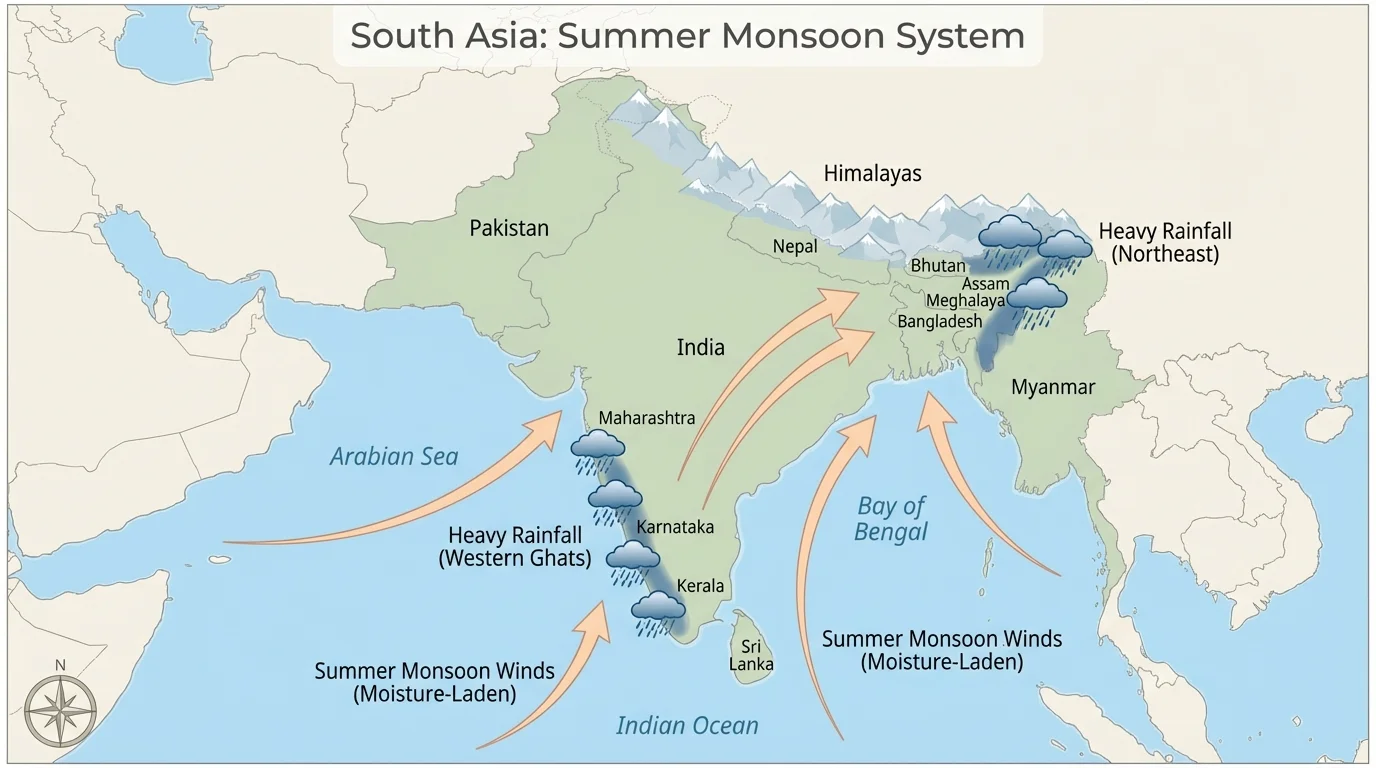
During the summer monsoon, warm land draws moist air from the ocean toward the continent, as [Figure 3] shows. As that air rises, it cools and drops rain. Areas along India's western coast and parts of northeastern South Asia receive especially heavy rainfall. From this evidence, a geographer can infer that winds, nearby oceans, and landforms help create uneven rainfall patterns across the region.
Another example comes from Japan. If maps show that Japan lies near tectonic plate boundaries and records show many earthquakes, a geographer can infer that Japan faces frequent seismic risk because of its location. That inference then helps explain why strict building codes and disaster planning are so important there.
In North Africa, data may show that population is concentrated along the Nile River and sparse in the surrounding Sahara Desert. From this, a geographer can infer that dependable water, fertile soil, and transportation access support human settlement, while dry desert conditions limit it.
Case example: inferring from climate and settlement data
A geographer studies two regions. Region A has low annual rainfall, very high summer temperatures, and scattered towns. Region B has a river, moderate rainfall, and dense farming villages.
Step 1: Compare the environmental data.
Region A is dry and hot, while Region B has more available water.
Step 2: Compare the human data.
Region A has fewer settlements, while Region B has many closely spaced villages.
Step 3: Make an evidence-based inference.
The geographer infers that water availability strongly affects where people settle and farm.
This kind of reasoning is common in both physical and human geography.
As with the monsoon pattern in [Figure 3], an inference becomes stronger when several kinds of evidence point to the same conclusion.
Predictions use present data to estimate what may happen later. They are not guarantees, but they are based on evidence. If a coastal city in Southeast Asia is growing fast and maps show low-lying land near the shore, geographers may predict that future flood risk will become more serious, especially if sea level rises or storms intensify.
Population trends are one common source of prediction. If a city has grown from about 5 million to about 8 million people over a set period, planners may predict continued demand for housing, schools, roads, and water. If rural jobs are declining while city jobs are increasing, geographers may predict migration toward urban areas.
Climate data also supports prediction. If rainfall has become less reliable in a semi-arid region, geographers may predict more frequent water shortages. If average temperatures increase in a mountain area, they may predict changes in snowpack and river flow. Farmers, engineers, and governments all use such predictions to make decisions.
"The best predictions are not wild guesses. They are careful readings of patterns."
Geographic prediction is especially useful for preparing for hazards. In earthquake-prone or flood-prone areas, data helps leaders decide where stronger buildings, warning systems, or evacuation routes are needed.
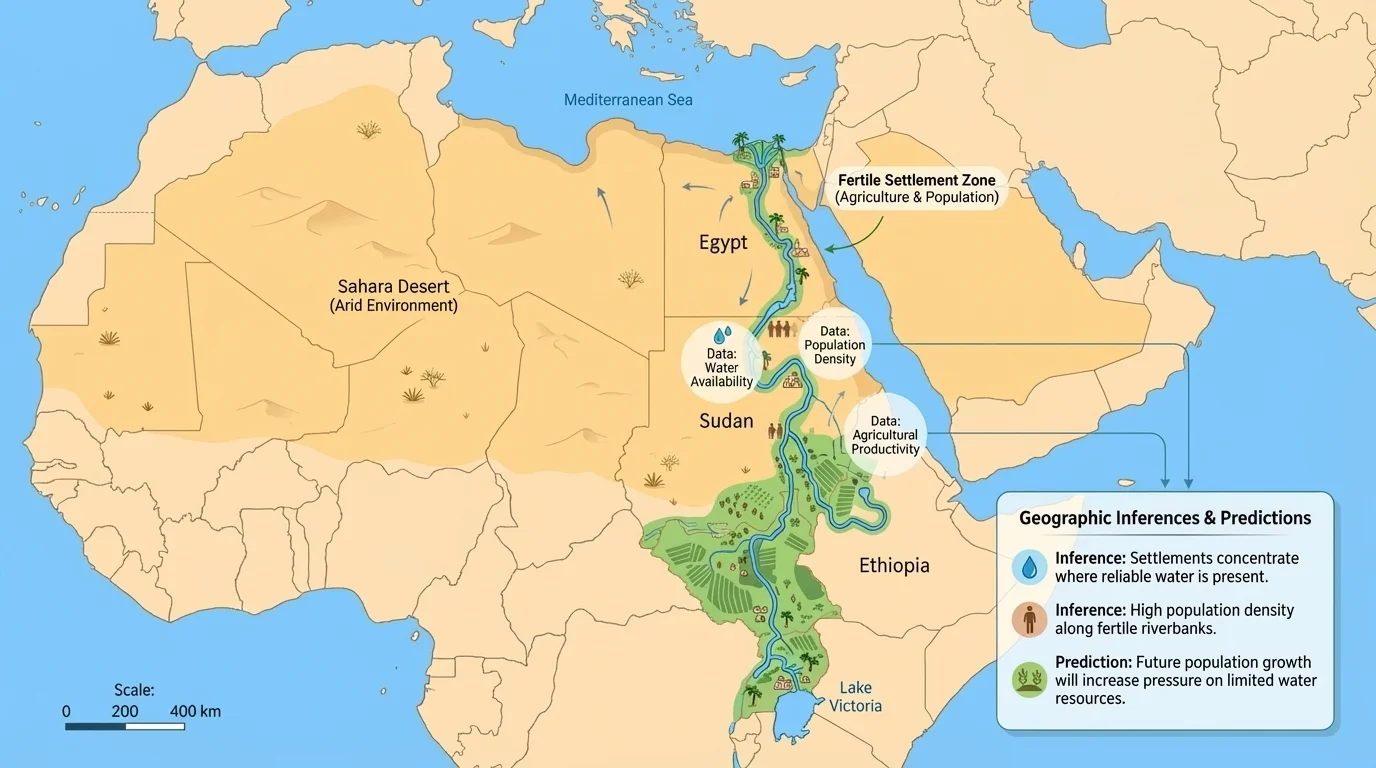
The Nile River valley is one of the clearest examples of how geographic data leads to strong inferences. Settlement maps, vegetation maps, and water data all show the same pattern: most people in Egypt live close to the Nile, as [Figure 4] illustrates. The surrounding Sahara is much drier and supports far fewer settlements.
From this evidence, geographers infer that fresh water, fertile land, and transportation make the Nile corridor far more suitable for dense settlement than the surrounding desert. They may also predict that as Egypt's population grows, pressure on Nile water and farmland will increase.
South Asia offers another powerful case. Rainfall maps, wind patterns, and crop calendars show that millions of people depend on monsoon timing. If the monsoon arrives late or brings too little rain, crops may fail. If it brings too much rain, flooding may damage farms and cities. Geographers use this data to infer that seasonal winds shape both agriculture and daily life across the region.
East Asia shows how human geography can be analyzed through population and economic data. Coastal China, Japan, and South Korea include major urban centers connected by trade and industry. Geographers can infer that coasts with ports, transport links, and job opportunities attract large populations. They may also predict future urban expansion, traffic congestion, or increased demand for energy and water.
Later in the lesson's examples, the settlement pattern near the Nile in [Figure 4] remains a strong model of how one physical feature can shape an entire country's human geography.
Geographic data is powerful, but it has limits. Some data may be outdated, incomplete, or measured differently in different countries. A government census may miss people who move often. A rainfall average may hide extreme wet and dry years. A map may look simple but leave out local detail.
Bias can also affect geographic information. Bias means that information may reflect a particular viewpoint or leave out important details. For example, a report written to support one political decision may emphasize some facts more than others. Geographers must compare multiple sources so that they do not depend too heavily on one point of view.
Scale can shape interpretation as well. A continental map may suggest that a region is empty, when a local-scale map reveals villages, farms, or roads. This is why strong geographic analysis uses data at the right scale for the question being asked.
Predictions are probabilities, not promises
If current trends continue, a prediction may be accurate. But conditions can change. A drought may end, a government may build new infrastructure, or a natural disaster may alter settlement patterns. Geographers revise predictions when new data appears.
Good geographic thinking is flexible. It uses evidence carefully, stays open to new information, and avoids jumping to conclusions too quickly.
These skills matter far beyond the classroom. News reports about drought in East Africa, floods in Bangladesh, urban growth in China, or earthquakes in Turkey all depend on collecting and analyzing geographic data. Travel planning, farming, public health, transportation, and environmental protection all use geographic inference and prediction.
If you understand how to read a map, compare data, and look for patterns, you are learning to think like a geographer. You can ask stronger questions about why places are different, why people move, why cities grow, and how environments affect human choices. That kind of thinking makes geography a tool for understanding both the natural world and human society.