A city may flood because of heavy rain, a farm may struggle because of drought, and a port may grow rich because of its location. None of those outcomes happen randomly. Geographers study patterns in land, water, climate, population, and resources to explain why places develop the way they do. In the Eastern Hemisphere, these patterns shape daily life from the rice fields of South Asia to the crowded ports of East Asia and the dry grasslands of Africa.
Geographic data is information about Earth's surface and the people who live on it. It includes rainfall totals, temperature records, elevation maps, population density maps, trade routes, land use maps, satellite images, and migration data. When geographers assess this information carefully, they can do three powerful things: draw conclusions about what is happening, make predictions about what may happen next, and justify solutions to real problems using evidence and logical reasoning.
When leaders decide where to build roads, farmers choose what to plant, or communities prepare for storms, they depend on geography. A place's climate, landforms, water supply, and location all affect what people can do there. Geographic data turns those features into evidence. Instead of saying, "This area seems crowded," a geographer can point to a population map and show that one region has a higher population density than another. Instead of saying, "Flooding might be a problem," a geographer can compare rainfall, river levels, and elevation data.
This matters at different scales. A local decision might involve where to place a new well in a village. A state or provincial decision might involve how to manage a river basin across several districts. A national decision might focus on food security, transportation, or disaster planning. A global decision could involve climate change, international aid, or trade networks that connect many countries.
Geographic data is information about Earth's physical features and human activities, such as climate, landforms, population, resources, and movement.
Evidence is information used to support a conclusion.
Inference is a conclusion reached by combining evidence with reasoning.
Prediction is a statement about what is likely to happen in the future based on patterns and trends.
Good geographic thinking is not guessing. It is a careful process of looking at reliable information, noticing patterns, comparing places, and explaining why those patterns exist. That is why geographers often combine different sources rather than trusting just one.
Geographers use many kinds of tools to study the Eastern Hemisphere, and [Figure 1] shows how several of these sources can work together to explain one place from more than one angle. A political map shows boundaries and cities. A physical map shows mountains, rivers, deserts, and plains. A climate graph shows temperature and precipitation over time. Satellite images reveal vegetation, clouds, urban growth, and water levels. Population maps show where people are concentrated. Transportation maps show roads, rail lines, ports, and shipping routes.
Another important tool is a thematic map, which focuses on one topic such as rainfall, languages, population density, or natural resources. A thematic map can reveal patterns that are not obvious on a general map. For example, a rainfall map of Africa helps explain why tropical forests grow near the equator while deserts dominate parts of the north and southwest.
Geographers also use satellite images to observe changes over time. By comparing images from different years, they can see whether cities are spreading, forests are shrinking, or lakes are changing size. This is especially useful in areas that are hard to visit regularly.
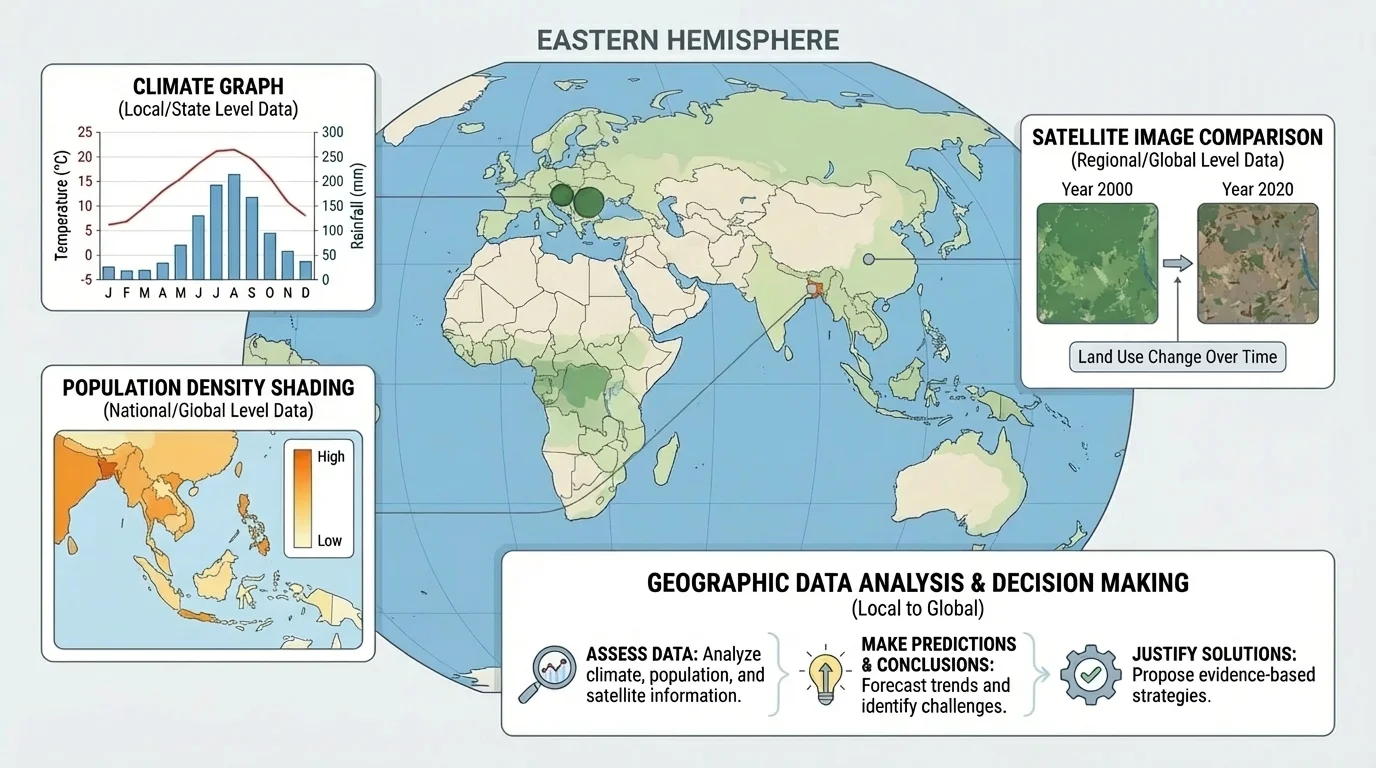
Modern geographers often use GIS, which stands for Geographic Information Systems. GIS allows people to layer data on top of a map. One layer might show elevation, another roads, another rainfall, and another population. When these layers are combined, relationships become easier to see. For middle school students, you can think of GIS as a smart digital map system that helps answer geographic questions.
Sources can be primary or secondary. A satellite image or a government census is a primary source of data. A textbook map based on those records is a secondary source. Both are useful, but geographers should always ask where the information came from and how current it is.
Reading geographic data involves more than spotting a place on a map. First, identify the scale. A world map may show broad patterns, but it can hide local details. A city map may show individual neighborhoods, roads, and flood zones. If you use the wrong scale, you may miss important information.
Next, check the legend, labels, direction, and dates. A map key explains symbols and colors. The date matters because places change over time. Population data from ten years ago may not match the present. Climate averages may cover many decades, while disaster maps may show only one event.
Then, look for patterns. Are people clustered near coasts? Are farms located near rivers? Are dry areas expanding? After noticing patterns, ask why. This is where reasoning begins. A pattern is the evidence; the explanation is the inference.
How geographers assess evidence
Geographers ask several key questions: What does the data show? How reliable is the source? What patterns appear? What physical or human factors help explain those patterns? Does another source confirm the same conclusion? Strong conclusions come from multiple pieces of evidence, not one isolated fact.
Reliability is also important. A map made by a scientific agency is usually more dependable than an unlabeled image shared online. Geographers compare sources to reduce mistakes. If a rainfall graph, a river flood record, and a satellite image all point to the same conclusion, confidence in that conclusion grows.
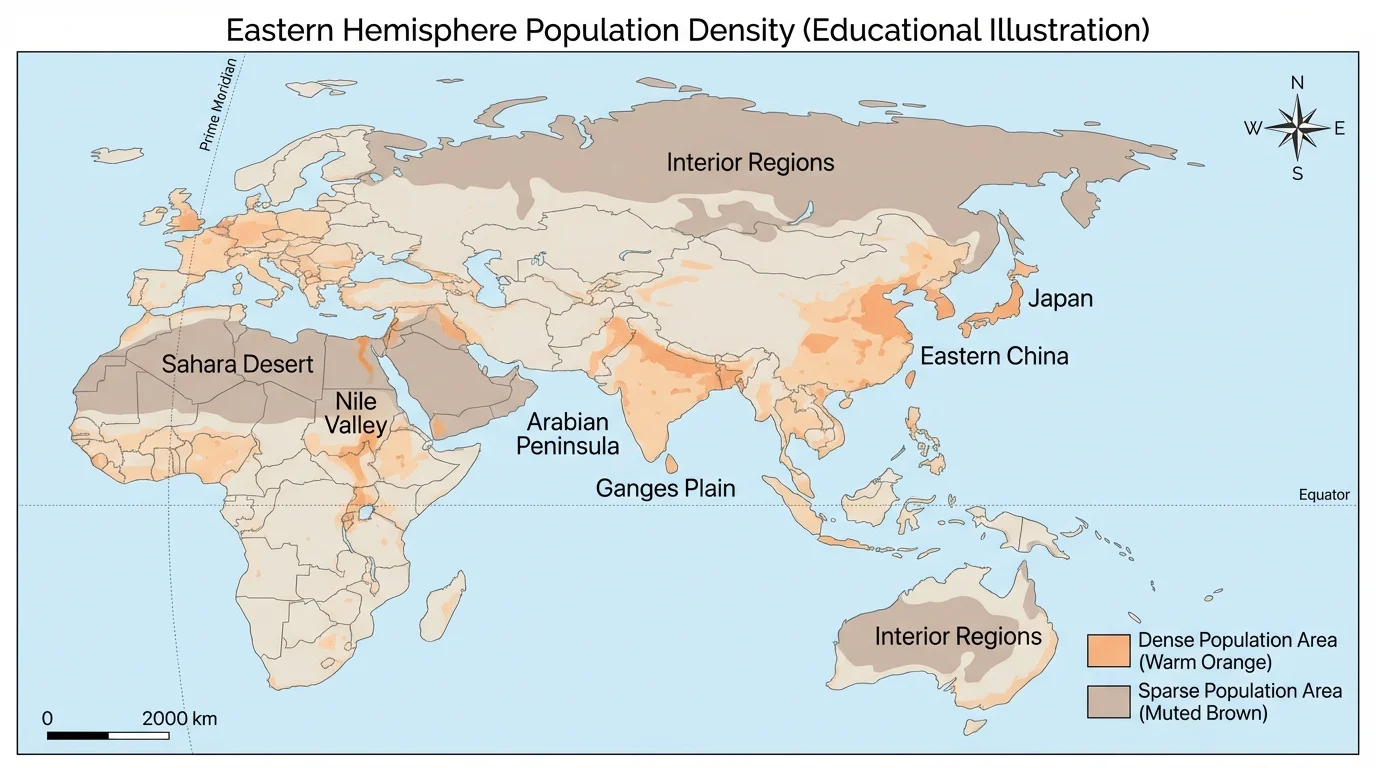
Across the Eastern Hemisphere, geographic data reveals that people do not spread out evenly, and [Figure 2] illustrates how many large population clusters are located near fertile plains, rivers, and coasts. This pattern appears in the Nile Valley, the Ganges Plain, eastern China, Japan's coastal lowlands, and parts of Southeast Asia. These areas usually offer water, transportation, rich soil, and easier trade.
By contrast, some regions have sparse populations because conditions are harsher. The Sahara Desert has very little rainfall. The cold interior of Siberia has a severe climate. High mountain regions such as the Himalayas are difficult for farming, travel, and settlement. From these data, a geographer can conclude that physical features strongly affect where people live.
Geographic conclusions also connect human activity to the environment. For example, heavy use of river water for farming may lower water levels downstream. Expanding cities may replace farmland. Deforestation on hillsides may increase erosion and flooding. These conclusions are stronger when they are based on several sources, such as maps, images, and records from different years.
The same type of thinking can be used for economic activity. Major ports often grow where coastlines, rivers, and trade routes connect. This helps explain why coastal East Asia includes many large cities. Geography influences movement of goods, not just movement of people.
The Nile Valley is a narrow ribbon of dense settlement surrounded by desert. A map makes this pattern stand out immediately, which is why geographic data can reveal things that are hard to understand from words alone.
Once geographers understand a pattern, they can predict future outcomes. A trend is a direction of change over time. If rainfall has decreased for many years in a dry region, future water shortages may become more likely. If a city keeps spreading into low-lying coastal land, flood risk may increase.
Predictions are not perfect, but they are more reliable when they use strong evidence. If several years of temperature data show warming and glacier data show melting, geographers can predict changes in river flow. If population data show rapid urban growth, they can predict rising demand for housing, water, and transportation.
Predictions should be logical. For example, if a region's average annual rainfall falls from about \(800\) millimeters to about \(500\) millimeters over time, crops that require large amounts of water may struggle more often. A geographer would not claim that every year will be dry, but would say drought risk is increasing.
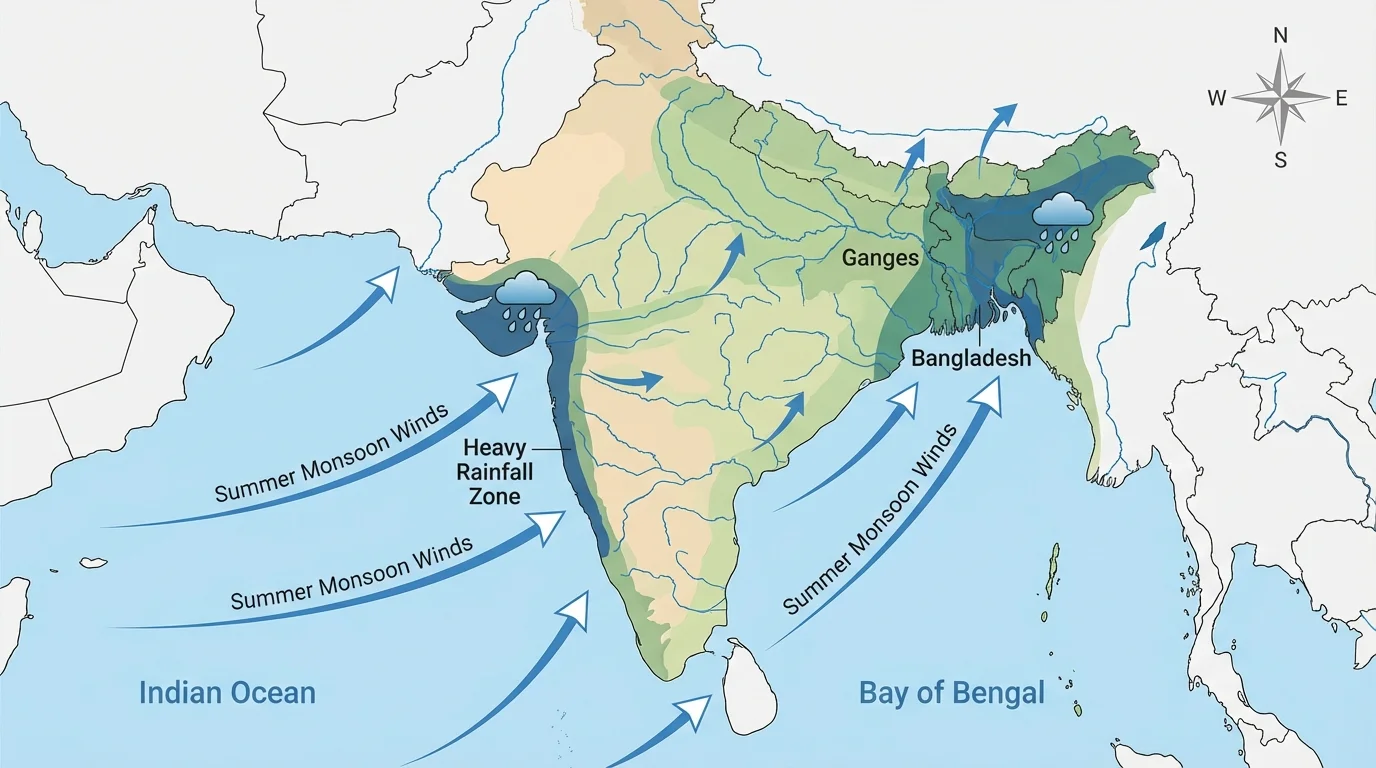
South Asia depends heavily on the monsoon, a seasonal wind system that brings major changes in rainfall, and [Figure 3] shows how ocean-to-land winds deliver heavy summer rain to many parts of India and Bangladesh. This is one of the clearest examples of geographic data being used to draw conclusions and make predictions.
Maps of wind direction, rainfall totals, river systems, and elevation help explain why some areas flood more easily than others. Bangladesh, for example, lies on a low-lying delta where large rivers meet the sea. Heavy monsoon rains upstream can swell rivers and create dangerous flooding downstream. A geographer can conclude that both climate and landforms contribute to flood risk.
Rainfall data also helps with prediction. If weather records show especially strong monsoon conditions, officials may predict flooding in vulnerable districts. If rainfall arrives late or weakly, farmers may predict lower crop yields. These predictions affect decisions about planting, storing grain, and preparing shelters.
Solutions depend on scale. At the local level, villages may build raised houses or improve drainage. At the state or provincial level, authorities may strengthen embankments and coordinate emergency warnings. At the national level, governments may improve flood forecasting and transportation networks. At the global level, countries and aid organizations may share weather technology and disaster relief.
Case study reasoning: monsoon flooding in Bangladesh
Step 1: Gather evidence
Use rainfall maps, river level records, elevation maps, and satellite images of flood extent.
Step 2: Draw a conclusion
The combination of heavy rain, large river systems, and low elevation increases flood danger.
Step 3: Make a prediction
If seasonal forecasts show above-average rainfall, flooding is likely to affect more homes, roads, and cropland.
Step 4: Justify a solution
Early warning systems and raised shelters are reasonable because the data shows repeated flood risk in low-lying areas.
This case reminds us that one map is not enough. The strongest geographic understanding comes from combining climate, landform, and human settlement data.
The desertification challenge in the Sahel shows how environmental and human factors can interact, and [Figure 4] highlights the Sahel as a transition zone just south of the Sahara where changing rainfall and land use place pressure on the land. The Sahel stretches across Africa from west to east and has frequent rainfall variation.
Geographic data from the Sahel may include rainfall records, vegetation maps, livestock numbers, farming patterns, and satellite images over many years. When vegetation decreases and dry land expands, geographers may conclude that drought, overgrazing, and soil stress are contributing to land degradation. The cause is usually not just one thing.
Predictions matter here because communities depend on farming and herding. If rainfall remains low and grass cover continues shrinking, future food insecurity may increase. Migration may also increase as families move to cities or other regions in search of work and water.
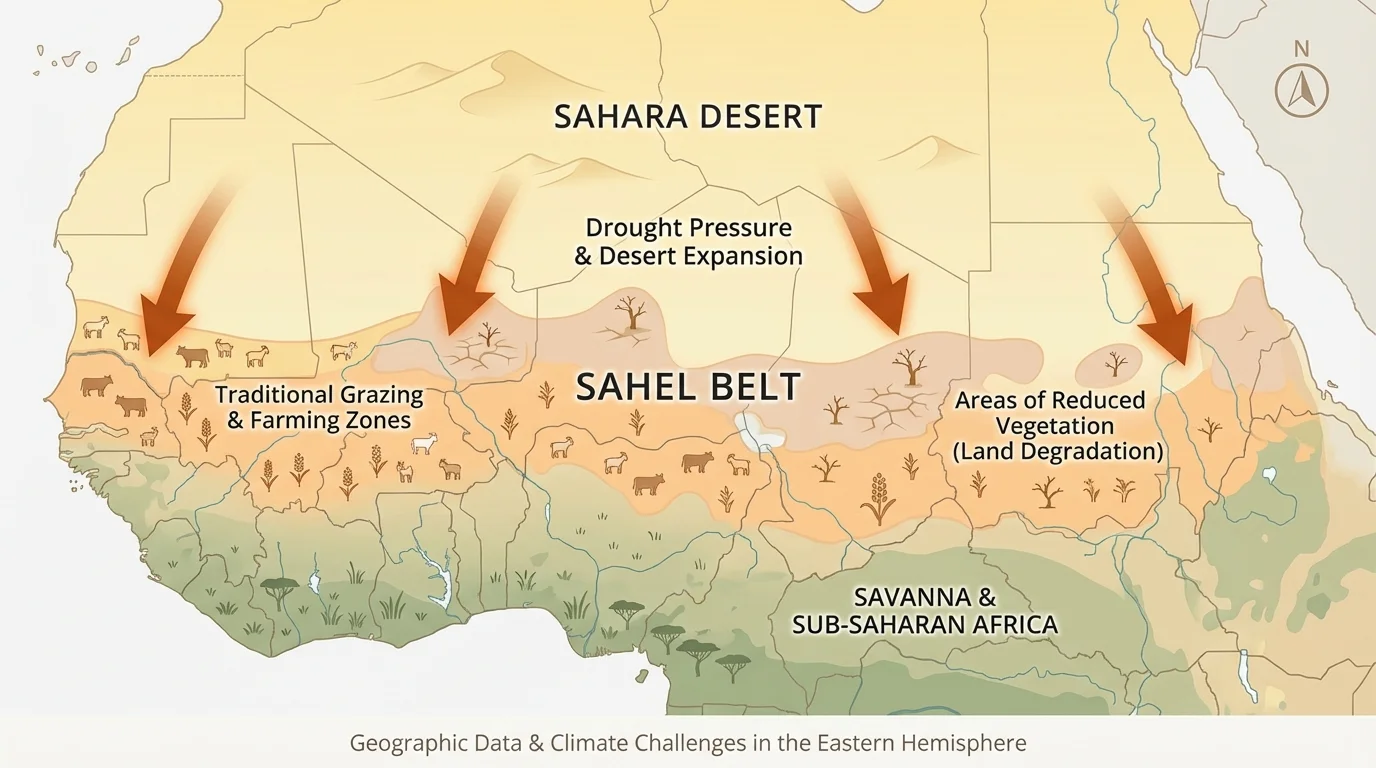
Possible solutions must be justified with evidence. Planting trees can help in some areas because roots hold soil and reduce erosion. Better grazing management can prevent overuse of fragile grasslands. Water-harvesting methods can help farmers save scarce rainfall. These are not random ideas; they are responses linked to the patterns visible in the data.
As we saw earlier with settlement patterns in [Figure 2], physical geography shapes human choices. In the Sahel, limited rainfall and fragile soils make land management especially important.
East Asia includes some of the world's busiest coastal cities, and [Figure 5] demonstrates why combining population, elevation, and storm-risk data is so important in these places. Cities such as Shanghai, Tokyo, and Osaka grew in part because coastal locations support trade, transportation, and industry.
But the same location can create problems. Low-lying coastal land may face typhoons, storm surges, and sea-level rise. If a map shows dense population in areas only slightly above sea level, geographers can conclude that large numbers of people and valuable infrastructure are exposed to water-related hazards.
Predictions come from trends in sea level, urban growth, and extreme weather. If sea level rises and construction continues in exposed areas, the risk to homes, ports, and transportation systems will likely increase. Because these cities are economically important, local flooding can even disrupt global supply chains.
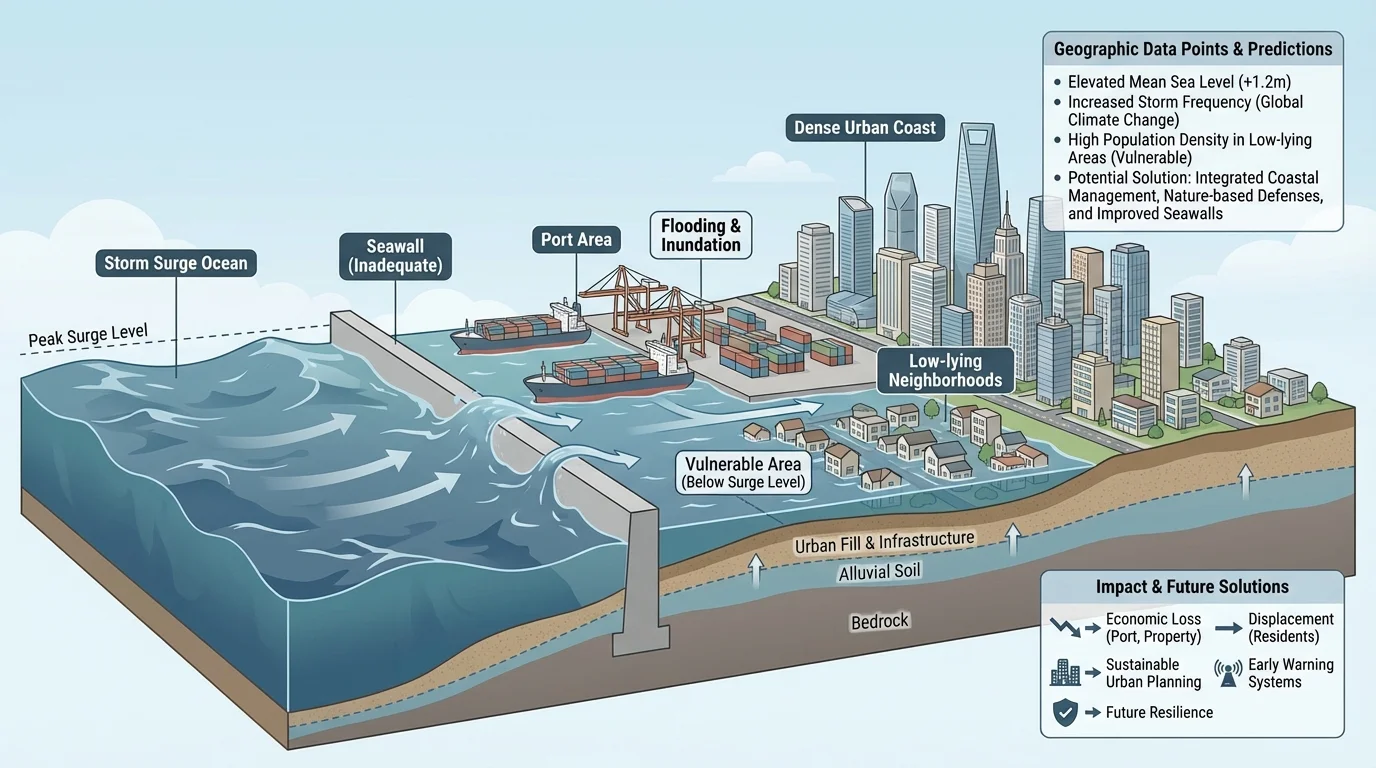
Solutions can be compared and justified. Seawalls may protect some districts. Wetlands can absorb water in certain locations. Strong building codes and evacuation systems reduce danger. A national government may invest in major coastal defenses, while city governments may improve drainage and warning systems. Global cooperation may focus on climate research and reducing greenhouse gas emissions.
Physical geography includes landforms, climate, water, and natural vegetation. Human geography includes population, cities, trade, land use, and movement. Strong geographic conclusions usually connect both.
A good solution is not just possible; it is supported by evidence. Suppose a low-lying community in Bangladesh floods repeatedly. Building a ski resort there would make no sense, but improving drainage, warnings, and raised shelters would match the data. Geographic reasoning asks, "What solution fits this place and this pattern?"
At the local level, communities often respond directly to their immediate environment. At the state or provincial level, governments may manage watersheds, roads, or resource use across a larger region. At the national level, policies can guide disaster planning, agriculture, and energy systems. At the global level, countries may work together on climate monitoring, disease tracking, migration support, and trade.
| Scale | Example Problem | Evidence Used | Possible Solution |
|---|---|---|---|
| Local | Village flooding | Elevation map, rainfall data | Raised homes, drainage channels |
| State/Provincial | River basin water shortage | River flow records, irrigation maps | Water-sharing plan, reservoir management |
| National | Food insecurity during drought | Rainfall trends, crop yield data | Drought-resistant crops, grain reserves |
| Global | Coastal climate risk | Sea-level data, storm records | International climate cooperation and adaptation funding |
Table 1. Examples of geographic problems, supporting evidence, and solutions at different scales.
Notice that the same problem may require more than one scale of action. A drought can begin as a local crisis for one farming area, become a national food issue, and connect to global climate patterns. This is one reason geography is so useful: it helps people connect small places to larger systems.
One common mistake is assuming that because two things happen together, one must cause the other. If a city grows while air pollution rises, the two may be related, but geographers still need evidence before claiming direct cause. Another mistake is relying on one map or one year of data. Long-term patterns are often more useful than isolated snapshots.
Ignoring scale can also lead to weak conclusions. A national average may hide major local differences. For example, one country may appear to have adequate rainfall overall, while one region inside it suffers serious drought. This is why careful geographers move between scales rather than sticking to just one.
Finally, geographers must be aware that human decisions can change geographic patterns. Building dams, planting forests, expanding roads, or creating protected areas can reshape the environment over time. Geographic data does not just describe the world; it also helps people change it.
"Maps are not just pictures of places; they are tools for thinking about why places are the way they are."
Whether studying the monsoon in South Asia, land stress in the Sahel, or coastal risk in East Asia, the core skill remains the same. Gather reliable data, identify patterns, compare scales, connect physical and human geography, and support every claim with evidence. When geographers do this well, they can explain present conditions, estimate future change, and defend practical solutions.
The Eastern Hemisphere offers many examples because it includes enormous variety: deserts and deltas, mountain chains and megacities, forests and trade corridors. That variety makes geography both challenging and powerful. The more carefully we assess the data, the better our conclusions, predictions, and solutions become.