A map can do more than show where places are. It can help explain why cities grow near rivers, why storms strike some coasts more often than others, and why people move from one region to another. Geographers study Earth by asking questions and then searching for evidence in geographic sources. When you learn to examine those sources carefully, you are not just looking at information. You are using evidence to solve puzzles about the world.
Geography helps people understand spatial patterns. This means geographers pay attention to where things are, why they are there, and what might happen next. In the Western Hemisphere, this includes studying mountains, rivers, cities, climate zones, trade routes, farms, forests, coastlines, and populations from Canada to Chile and from the Caribbean to the Great Plains.
A good geographic investigation begins with a question. A strong question is clear, focused, and based on evidence. Instead of asking, "What is South America like?" a geographer asks, "How have the Andes Mountains shaped settlement and transportation in western South America?" That question is much easier to investigate because it names a place, a feature, and a relationship.
Geographic questions often fall into three big purposes. Some help us understand the past, such as how rivers influenced early settlements. Some help us analyze the present, such as why population is growing quickly in one city but not another. Others help us plan for the future, such as where homes should be built to reduce flood risk.
A geographic source is any map, image, graph, chart, database, text, or other record that gives information about places, people, environments, and spatial relationships.
An inquiry question is a question that guides an investigation and can be answered by examining evidence.
An inference is a conclusion drawn from evidence and reasoning, not from guessing.
Good questions do not appear by magic. They often begin with noticing something interesting in a source. A student might see that many large cities in North America are near water. That observation can lead to a better question: "Why are so many major cities located near coasts, rivers, or the Great Lakes?"
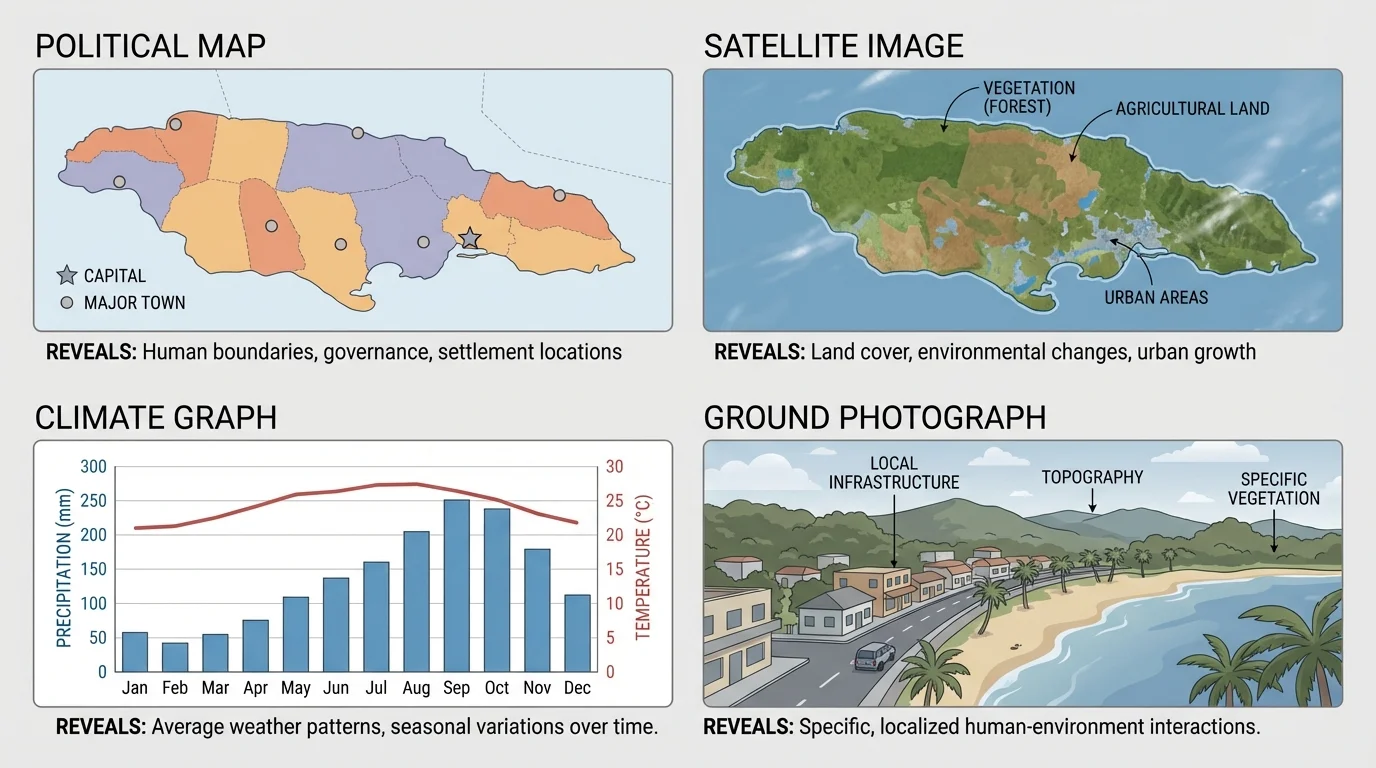
Different kinds of geographic sources reveal different kinds of information. A political map may show borders and capitals, while a physical map shows mountains, rivers, and elevation. A satellite image can reveal forests, clouds, fires, and urban growth. A climate graph can show average temperature and rainfall during the year. A photograph gives a ground-level view that helps you notice roads, buildings, farms, or coastlines.
[Figure 1] Geographers also use atlases, digital databases, census information, weather records, field notes, and GIS, which stands for Geographic Information Systems. GIS allows geographers to layer different kinds of data on one map. For example, a GIS map can combine population density, rainfall, roads, and flood zones to help answer a question about where new neighborhoods should be built.
Some sources are primary sources, which come directly from the time or place being studied, such as an old map, a diary, a government document, or a satellite image taken during a recent hurricane. Other sources are secondary sources, which explain or analyze information from primary sources, such as a textbook map or an article about migration trends.
No single source tells the whole story. A rainfall map might show that a region is dry, but a population map might show that many people still live there because irrigation, trade, or technology supports life. Looking at several sources together gives a fuller picture and helps geographers avoid weak conclusions.
Some cities in the Americas can be studied from space in remarkable detail. Satellite images can reveal where forests are being cleared, where rivers have changed course, and where urban areas have spread over time.
[Figure 2] When geographers compare sources, they often notice relationships. For example, they may compare a map of hurricane tracks in the Caribbean with a population map and ask why some islands face greater danger than others. The answer may involve storm frequency, elevation, building location, and access to emergency shelters.
Before making conclusions, a geographer studies the clues built into a source. On a map, these clues include the title, legend, scale, compass rose, labels, date, and source. The title tells what the map is about. The legend explains colors and symbols. The scale helps estimate distance. The compass rose shows direction.
The date matters because places change. A population map from twenty years ago may not match today's reality. The author and source matter too. Was the map made by a government agency, a scientist, a news organization, or a person with a strong opinion? Reliable sources are usually based on careful evidence and clear methods.
Geographers also watch for bias, which means a source may favor one viewpoint or leave out important information. A tourism poster of a tropical island may highlight beaches and sunshine but ignore hurricane risk or crowded housing. That does not mean the poster is useless. It means you should understand its purpose.
Scale can change how you understand a problem. At a continental scale, a map of South America may show broad climate zones. At a local scale, a city map may show neighborhoods, roads, and flood-prone streets. Both are useful, but they answer different questions.
As seen earlier in [Figure 1], one place can look different in a photograph, a graph, and a map. That is why geographers ask, "What kind of source am I using, and what can it show well?" A climate graph is excellent for showing seasonal change, but it cannot show exact neighborhood locations. A street map can show roads clearly, but it cannot explain yearly rainfall by itself.
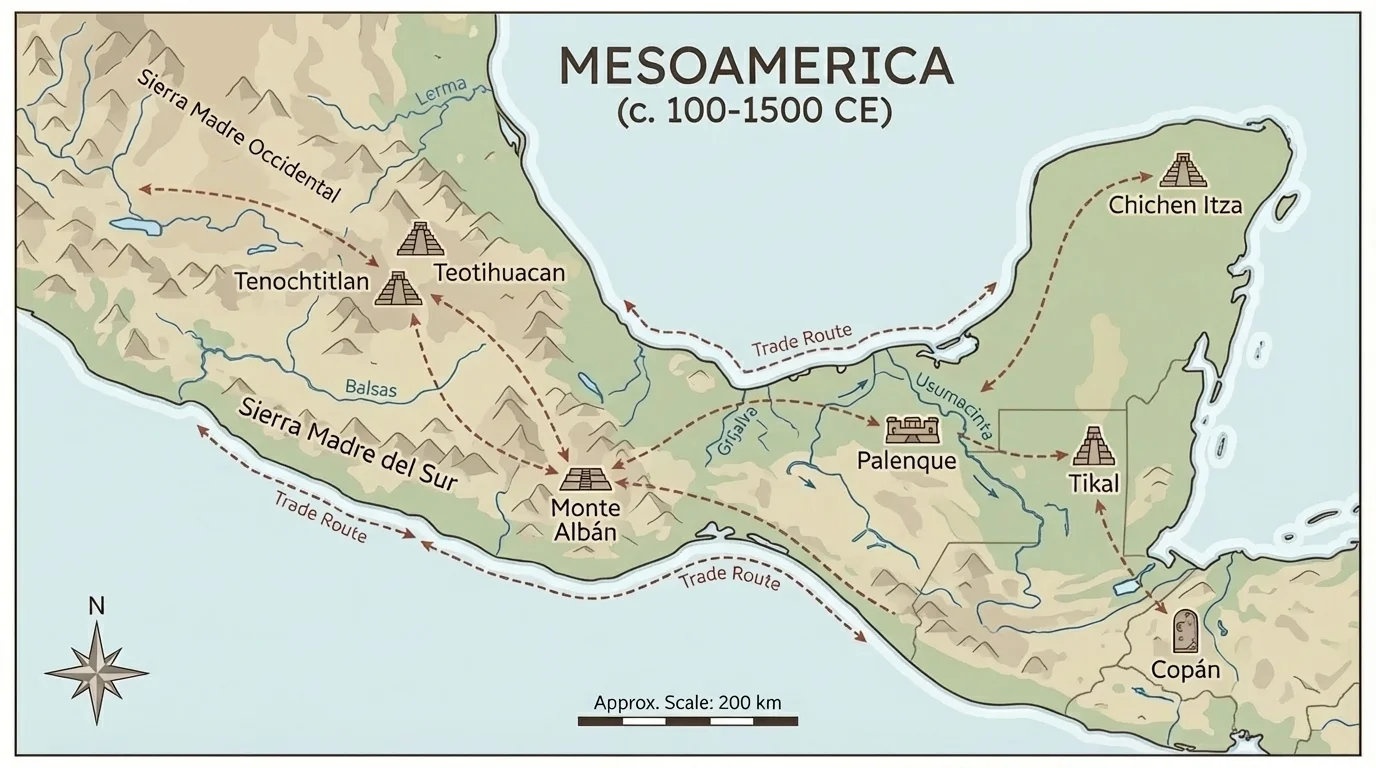
To turn a source into a strong inquiry question, start by observing carefully. What do you notice? What patterns stand out? What surprises you? Then move from observation to questioning. If a map shows that many settlements in ancient Mesoamerica were near rivers and fertile lands, you might ask, "How did access to water and fertile soil influence settlement patterns in Mesoamerica?"
Strong geographic questions often include one or more of these ideas: location, place, movement, human-environment interaction, and region. For example, "Why are people moving from rural areas to Mexico City?" asks about movement. "How does living near the Mississippi River help and challenge communities?" asks about human-environment interaction.
From observation to inquiry
A student studies a map showing large population clusters in eastern North America.
Step 1: Observe the pattern
The population is denser near the Atlantic coast, Great Lakes, and major rivers.
Step 2: Notice possible relationships
These places connect to transportation, trade, and freshwater access.
Step 3: Form a question
"How have waterways and transportation routes influenced where large cities developed in eastern North America?"
This question is specific, evidence-based, and open to investigation.
Weak questions are too broad, too simple, or impossible to answer with evidence. "Is South America cool?" is weak because the word cool is unclear. "Where are the driest places in South America, and how have people adapted to living there?" is much stronger.
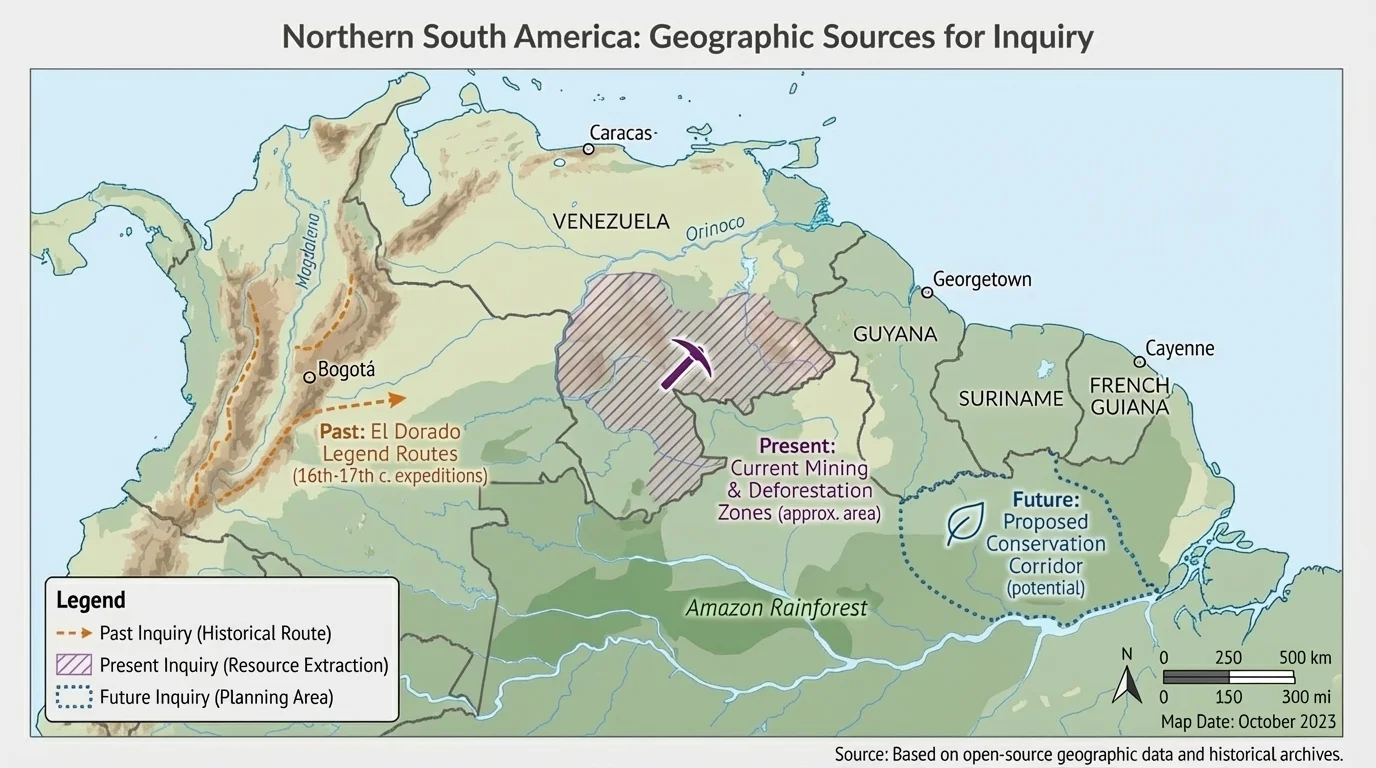
[Figure 3] Geographic sources can help explain history because human choices are connected to landforms, water, climate, and location. Historical maps help connect settlements, trade routes, and physical features. For example, many early civilizations in the Americas developed where water, fertile land, and transportation routes supported farming and exchange.
In the Andes region, steep mountains made travel difficult but also helped protect some communities. In Mesoamerica, fertile valleys and trade routes supported large centers of population. In North America, major river systems such as the Mississippi helped connect communities and transport goods long before modern highways existed.
Geographers can compare old and new maps to see change over time. A historical map of colonial settlements in the Caribbean can be compared with a present-day population map to ask how coastlines, harbors, plantations, and trade shaped modern settlement patterns.
Primary sources are especially valuable when studying the past. An explorer's journal, an early land survey, or an old port map can show how people described and used a place at that time. Secondary sources help explain those records and place them in context.
The relationship between geography and history appears again here, where settlements cluster near useful land and travel routes. This reminds us that historical events did not happen in empty space. They happened in real environments that offered opportunities and limits.
[Figure 4] Geographers also examine current issues by comparing geographic sources. They may study migration maps, land-use maps, weather data, and population charts to understand why a city is growing. They may compare drought maps with agricultural maps to investigate food production. They may use satellite images to track deforestation in the Amazon rainforest.
A present-day investigation often focuses on why a pattern exists. For example, why do many people live in coastal zones even though those areas face storm risk? Geographic sources may show that coasts offer ports, tourism, fishing, trade, and transportation. The same place can offer benefits and dangers at the same time.
Present analysis depends on patterns and relationships
Geographers do not just list facts about a place. They look for patterns, compare places, and explain relationships. If rainfall decreases while fire activity increases in a forested region, that pattern can lead to a deeper investigation about climate, land use, and human impact.
Consider the Amazon Basin. A satellite image may show forest loss. A road map may show new highways. A population map may show settlements expanding into forested areas. Together, these sources support inquiry questions such as, "How have transportation routes contributed to deforestation in the Amazon?"
Mexico City offers another example. A map of the city's growth, a chart of population change, and an elevation map can help students investigate housing, transportation, air quality, and water supply. Geography is not just about natural features. It is also about how people organize space and use resources.
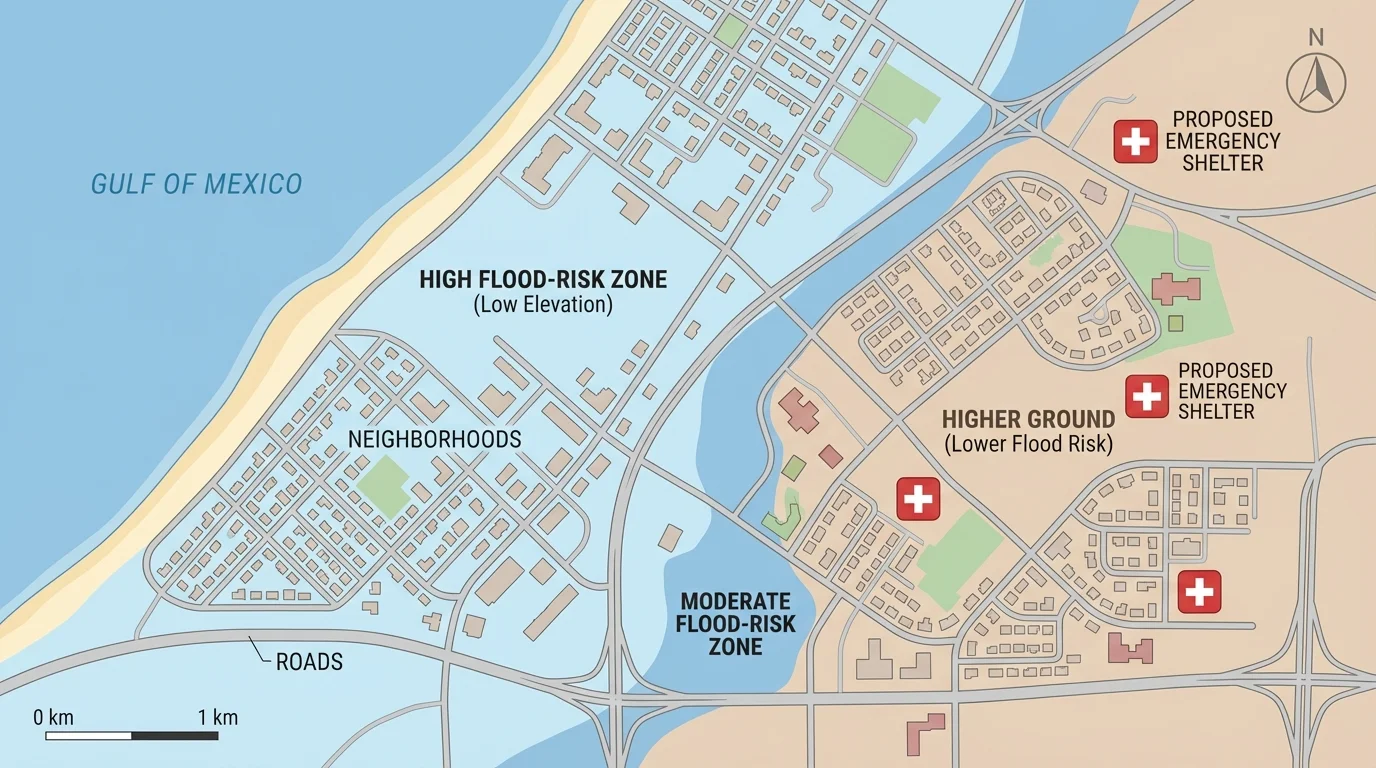
One of geography's most useful skills is using current evidence to think ahead. City planners, emergency managers, farmers, and scientists combine several kinds of geographic data. They ask questions such as, "Where is flooding most likely?" "Which neighborhoods need more evacuation routes?" and "Where should new schools or hospitals be built?"
Planning for the future does not mean guessing. It means making careful predictions from patterns in reliable evidence. If a coastal area in the Gulf of Mexico has low elevation, a history of storms, and dense population near the shore, geographers may predict higher risk during hurricanes. That prediction can help leaders place shelters on higher ground and improve roads for evacuation.
Farmers also use geographic information to plan. Rainfall records, soil maps, and temperature data can help decide which crops may grow best in a region. Communities in dry parts of the Western Hemisphere may use water-use maps and climate trends to prepare for drought.
Future planning often involves trade-offs. A site near the coast may be good for shipping and tourism but risky during storms. A flat valley may be good for farming but prone to flooding. Geographers help people weigh these choices by comparing benefits and risks.
Later decisions often return to the same kind of evidence shown on a hazard map. A hazard map is not just a picture. It is a tool for protecting lives, property, and resources.
The Amazon rainforest: Geographic sources such as satellite images, land-use maps, and road maps reveal where forests are changing. Inquiry questions may include, "Where is deforestation happening most rapidly?" and "How do roads and settlements affect forest loss?"
The Caribbean: Hurricane-track maps, elevation maps, and population maps help investigate why some islands face greater danger during storms. Questions may include, "How does elevation affect storm damage?" and "Which communities are most exposed along the coast?"
The Great Plains: Rainfall maps, soil maps, and agricultural maps can help explain farming patterns. A geographer might ask, "How does climate influence crop choices across the Great Plains?"
The Andes: Elevation maps, transportation maps, and settlement maps reveal the challenges of building roads and cities in mountainous areas. Questions may include, "How does elevation shape transportation routes in the Andes?"
| Place | Useful Sources | Possible Inquiry Question |
|---|---|---|
| Amazon Basin | Satellite images, road maps, land-use maps | How have roads influenced deforestation? |
| Caribbean islands | Hurricane maps, elevation maps, population maps | Why are some communities more vulnerable to storms? |
| Mexico City | Population maps, transportation maps, air-quality data | How has urban growth affected daily life and resources? |
| Great Plains | Rainfall maps, soil maps, farm maps | How does climate affect agriculture? |
Table 1. Examples of Western Hemisphere places, geographic sources, and inquiry questions.
After collecting evidence, geographers make inferences. A strong inference is based on several sources that support the same idea. If a map shows settlements near rivers, a soil map shows fertile land there, and a transportation map shows easy travel, it is reasonable to infer that those factors encouraged settlement.
A weak inference happens when someone jumps to a conclusion too quickly. For example, if one city has grown rapidly, it would be weak to assume that all cities in the region will grow for the same reason. Geographers look for enough evidence before deciding.
Remember that a pattern does not explain itself. Noticing that two things occur in the same place is only the beginning. The next step is finding evidence that explains the relationship.
Sometimes geographers compare data over time. If a city's urban area was one size in an earlier map and much larger in a later satellite image, that change supports an inference about urban growth. If storm damage is worst in low-lying areas across several hurricanes, that pattern supports an inference about elevation and risk.
One common mistake is relying on only one source. Another is ignoring the date of the source. A third is confusing correlation with cause. If two things happen together, that does not always mean one caused the other. More evidence is needed.
Another mistake is asking a question that is too broad. "Why is the Western Hemisphere the way it is?" is too large to investigate well. Breaking a huge question into smaller, clearer questions makes research possible.
It is also important not to ignore scale. A map of an entire hemisphere cannot answer the same questions as a neighborhood map. The right source depends on the question.
People use geographic inquiry in real life all the time. Weather experts study maps to forecast storms. Engineers use land and hazard maps before building roads and bridges. Conservationists examine satellite images to protect forests and wetlands. Community leaders use population data to decide where schools, parks, and services are needed.
Even everyday choices connect to geographic thinking. When families move, travel, or prepare for severe weather, they use information about location, distance, routes, and environmental conditions. Learning to examine geographic sources helps students become careful thinkers who use evidence instead of guessing.
When you ask a strong question, examine reliable sources, compare evidence, and make a reasoned inference, you are doing the work of geography. That work helps explain the past, make sense of the present, and prepare wisely for the future across the Western Hemisphere.