A city can grow for decades in one direction, a river can support a civilization for thousands of years, and a seasonal wind can determine whether crops survive or fail. Geography is not just about where places are. It is about asking why places develop the way they do and what might happen next. To answer those questions, geographers investigate evidence from maps, images, and data. The better the evidence, the better the questions.
When we study geography, we are really studying relationships: people and land, climate and farming, water and settlement, trade and movement. A good question helps us uncover those relationships. Instead of asking, "Where is Egypt?" a geographer might ask, "How did the Nile River influence where people settled in ancient Egypt?" That second question leads to deeper thinking about environment, resources, and human choices.
Geographic questions can help us understand the past, such as why early civilizations grew near rivers. They can help us analyze the present, such as why some cities are becoming overcrowded. They can also help us plan for the future, such as where new homes, roads, or flood-control measures should be built.
These questions are especially useful in the Eastern Hemisphere, which includes Africa, Europe, Asia, and Australia. This enormous part of the world includes deserts, rainforests, mountains, river valleys, coasts, islands, and major urban centers. Because it contains so many different environments, it gives geographers many chances to compare places and explain patterns.
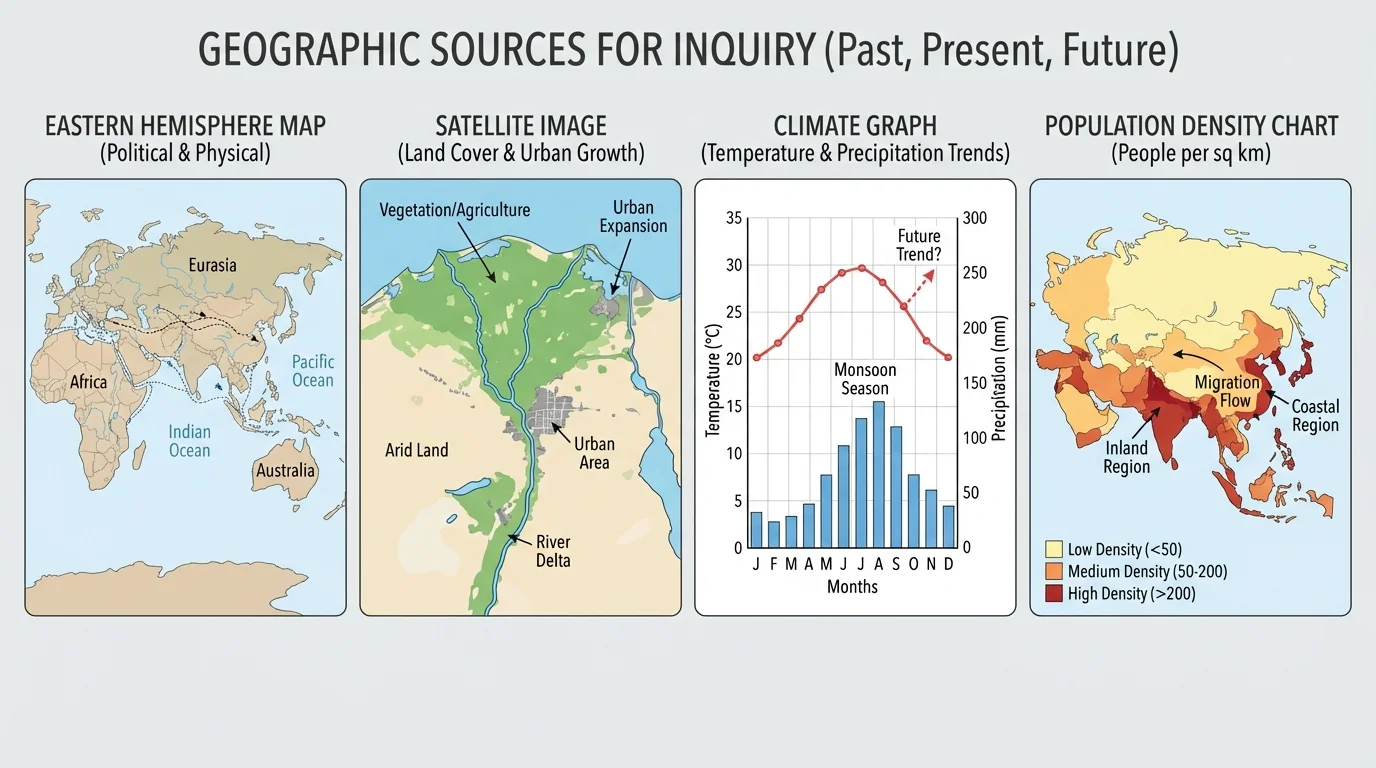
Geographers gather evidence from many kinds of sources, and [Figure 1] illustrates how several source types work together rather than separately. One map may show where mountains are located, while a climate graph shows rainfall, and a population map shows where many people live. When these sources are compared, geographers can ask stronger questions.
A geographic source is any tool or record that provides information about places, environments, and human activity. Geographic sources include physical maps, political maps, thematic maps, satellite images, aerial photographs, charts, graphs, climate records, census data, historical documents, travel accounts, and artifacts connected to location.
Some sources are primary sources, which come directly from the time being studied. A ship log from Indian Ocean traders, an old map, or a farmer's record of rainfall can all be primary sources. Other sources are secondary sources, which explain or interpret information after the fact, such as textbooks, documentaries, or articles written by historians and geographers.
Different sources answer different kinds of questions. A political map helps identify borders and countries. A physical map shows landforms such as mountains, rivers, and deserts. A thematic map focuses on one topic, such as language, rainfall, or natural resources. Satellite images reveal features that may not be obvious on a traditional map, such as urban expansion, shrinking lakes, or forest loss.
Geographers often compare sources because one source alone rarely tells the whole story. A map might show that many people live near a coastline, but a climate graph may explain that the area has enough rainfall for farming, while a trade map may show that ports help the economy. As with the combined evidence in [Figure 1], stronger understanding comes from using more than one kind of source.
Observation is something directly noticed in a source. Inference is a reasoned idea based on evidence in the source. Prediction is a statement about what may happen in the future based on patterns and evidence. An inquiry question is a question designed to investigate a topic deeply rather than just collect a simple fact.
If a student sees on a map that cities cluster near rivers, that is an observation. If the student concludes that rivers support transportation and farming, that is an inference. If the student then predicts that future population growth may continue near major rivers, that is a prediction. Each step depends on evidence.
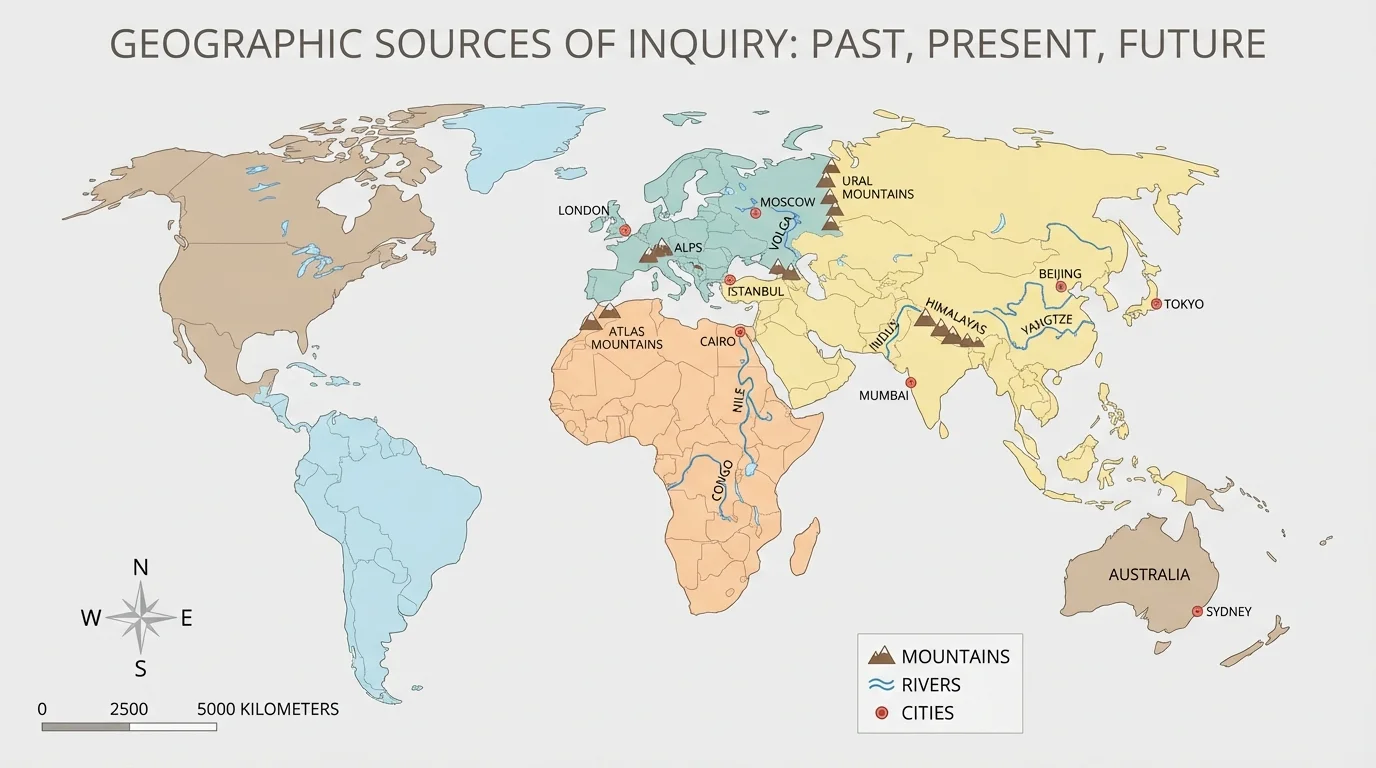
[Figure 2] A source is only useful if you know how to read it. On maps, geographers look closely at features such as the title, legend, compass rose, symbols, and scale. Without these features, a student might misunderstand distance, confuse symbols, or miss the map's purpose.
Scale matters because it changes what you can see. A small-scale map that covers a huge area, such as all of Asia, helps identify broad patterns. A large-scale map of one city shows finer details, such as roads, neighborhoods, and land use. A geographer might use both: one to see the big pattern and one to study local effects.
Location also matters. Geographers often ask where something is in relation to something else. Is a city inland or coastal? Is farmland near a river or dependent on seasonal rain? Is a trade route passing through a mountain gap or across open sea? Relative location often helps explain why a place developed in a certain way.
Patterns are another key clue. A pattern might be clustered, spread out, or arranged along a line such as a coast, road, or river. If population dots cluster around deltas and coastlines, geographers can investigate whether fertile soil, fishing, trade, or transportation influenced settlement.
Reliable inquiry also requires asking whether a source is complete, current, and trustworthy. A map from hundreds of years ago may be useful for learning what people believed at the time, but it may not be accurate by modern standards. Data can also contain bias if it leaves out certain groups or areas. Careful readers ask: Who made this source? When? For what purpose? What might be missing?
Satellite images can reveal changes that happen slowly enough to escape everyday notice, such as shrinking lakes, deforestation, or new roads spreading outward from a city over many years.
That is why geographers rarely trust a single source by itself. They cross-check evidence. A rainfall graph might support what a climate map shows. A historical account might match settlement patterns on an old map. The map features shown in [Figure 2] help with basic reading, but deeper understanding comes from comparing evidence.
Strong inquiry questions usually begin with something noticeable in a source. The student sees a pattern, difference, or change and then asks why it exists. This means the question is not random. It grows from evidence.
Weak questions are often too simple, too broad, or answerable with one fact. "Where is the Sahara?" is useful for location, but it does not lead very far. "How has the Sahara Desert affected trade, migration, and settlement in North Africa?" is stronger because it invites investigation of multiple relationships.
A useful inquiry question often includes one or more of these ideas: cause, effect, change over time, comparison, or future impact. Students can build questions by using sentence starters such as: "How did geography influence...?" "Why are people concentrated in...?" "What patterns appear in...?" "How might this change if...?"
Turning observations into questions
Step 1: Observe the source
A population map shows that many large cities in East Asia are located near coasts and rivers.
Step 2: Notice the pattern
The cities are not spread evenly inland. They are clustered near transportation and water access.
Step 3: Formulate an inquiry question
"Why have coastal and river locations encouraged the growth of major cities in East Asia?"
Step 4: Extend toward prediction
"How might future sea-level rise affect where East Asian cities expand?"
Notice that the best questions do not guess wildly. They remain connected to evidence. A question should be open enough to investigate, but focused enough to answer using sources.
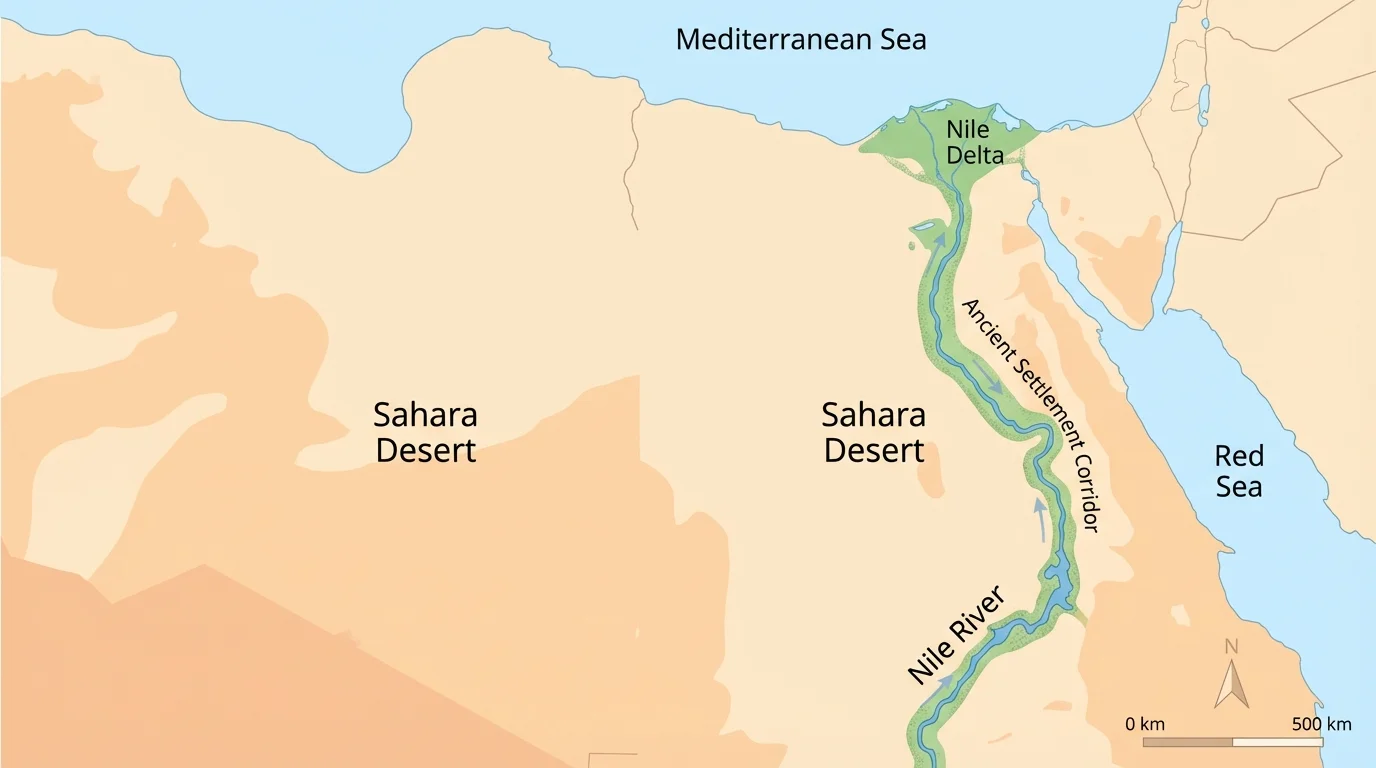
[Figure 3] Geographic sources can help explain why past societies developed where they did. In northeastern Africa, the narrow green corridor of the Nile stands out sharply against the surrounding desert. A student studying a physical map of Egypt can observe that most settlement areas were close to the river.
From that observation, the student can infer that water, fertile soil, and transportation supported life there. This leads to inquiry questions such as: "How did the Nile River support political unity in ancient Egypt?" or "Why did agriculture develop along the Nile floodplain rather than in nearby desert regions?"
Historical timelines and written records strengthen the investigation. Ancient records of flood cycles, farming, and travel can be compared with maps of the river valley. If annual flooding enriches the soil, then geography directly shapes food production, population growth, and the power of rulers who control irrigation and storage.
Another example from the Eastern Hemisphere is the Indian Ocean trade network. By examining trade maps, seasonal wind maps, and records from merchants, geographers and historians can ask why certain ports became powerful. The seasonal pattern of monsoon winds allowed ships to travel in one direction during part of the year and return during another. Geographic evidence helps explain the timing and direction of trade.
Questions about the past may include: "How did monsoon wind patterns influence trade between East Africa, Arabia, India, and Southeast Asia?" or "Why did port cities grow where they did?" Here, geographic inquiry reveals that history is shaped not only by leaders and events, but also by landforms, water, and climate.
"Geography is the key to history."
— A guiding idea in social studies
The same reasoning used for the Nile in [Figure 3] can be applied elsewhere. River valleys, passes through mountains, and coastlines often become centers of movement and settlement because they make survival and exchange easier.
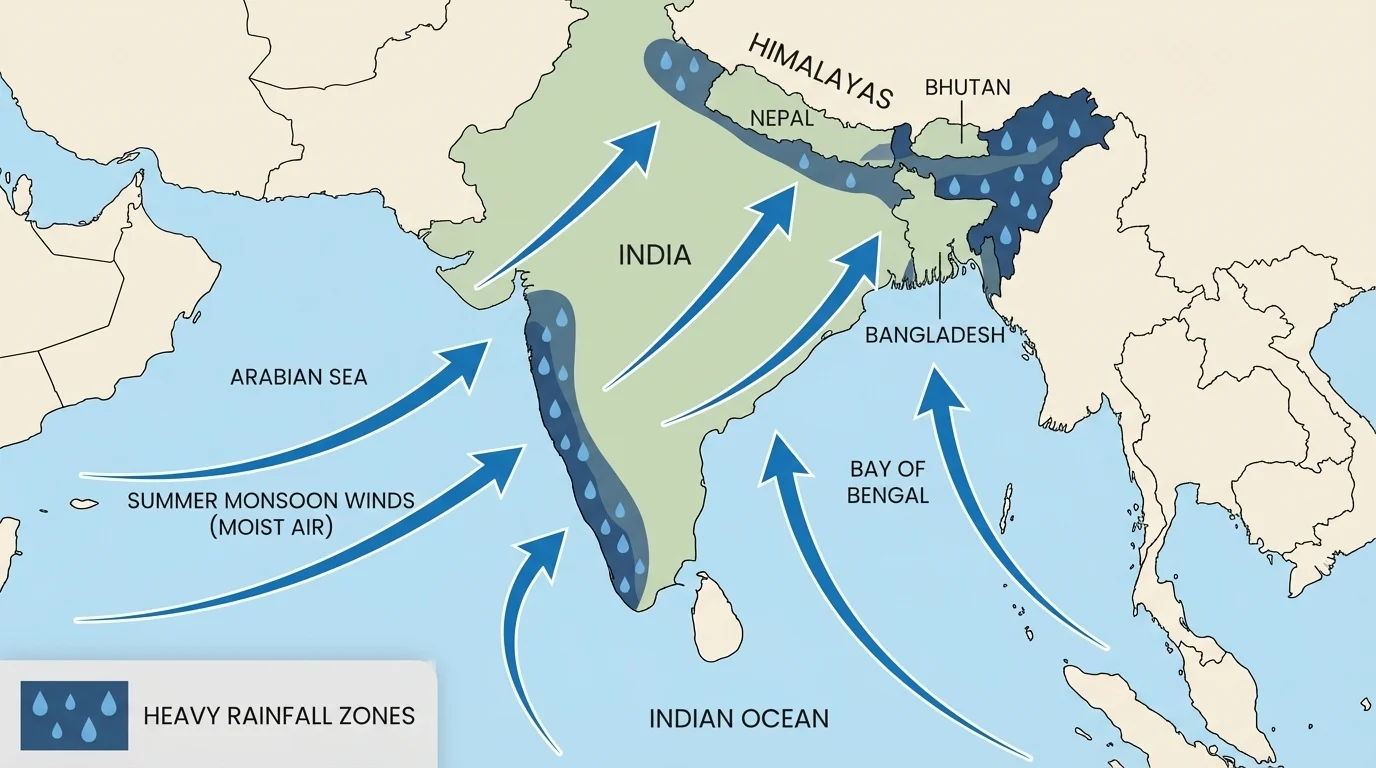
[Figure 4] Geographic sources are just as important for understanding current issues. In South Asia, climate maps, rainfall graphs, and wind maps reveal the major influence of the monsoon. This pattern affects agriculture, water supply, transportation, and even public safety.
If a source shows unusually strong rainfall in one year, students might ask, "How do stronger monsoon rains increase flooding in Bangladesh?" If rainfall is lower than average, they might ask, "How could weak monsoon seasons affect food production in India?" These questions connect climate to real human consequences.
Another present-day issue is desertification in the Sahel, the region south of the Sahara. Satellite images over time, vegetation maps, and rainfall data can reveal whether land is becoming drier and less productive. Inquiry questions might include: "How do changing rainfall patterns and human land use contribute to desertification in the Sahel?" or "How might desertification influence migration within Africa?"
Urban growth is another powerful topic. Population maps and satellite images of cities such as Shanghai, Mumbai, Lagos, or Tokyo can show outward growth, crowded coastlines, and changing land use. Geographers may ask why some cities expand rapidly, where new neighborhoods appear, and which areas face the most environmental stress.
Current geographic questions matter because they guide decisions. Governments, farmers, engineers, and community leaders all rely on geographic evidence. The wind and rainfall pattern in [Figure 4] is not just a map pattern; it affects harvests, housing, roads, and emergency planning.
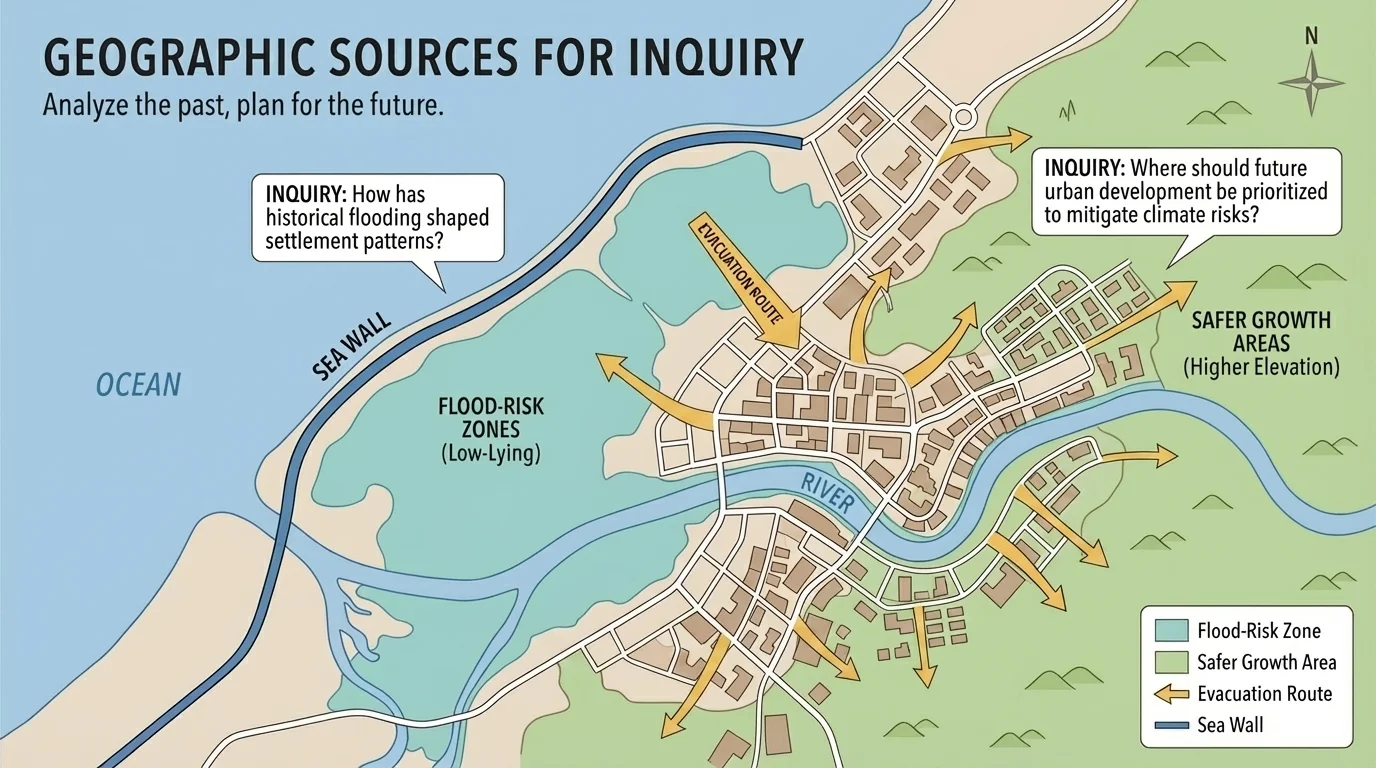
[Figure 5] One of the most powerful uses of geographic investigation is planning ahead. City planners, scientists, and governments use maps and data to estimate where future risks and opportunities may appear. Geographic sources help people decide where to build, what to protect, and how to prepare.
For example, a coastal city in Asia may compare elevation maps, storm records, and population density maps. If low-lying neighborhoods face increasing flood danger, planners can ask: "Which parts of the city are most vulnerable to sea-level rise?" and "Where should future housing be built to reduce risk?" Those are geographic inquiry questions because they are based on spatial evidence.
Farmers and water managers also use geographic data to plan. Rainfall maps, river-flow records, and soil maps can help answer questions such as: "Which regions may face water shortages if rainfall decreases?" or "How might irrigation systems need to change in drier parts of Southwest Asia?" Geographic evidence supports practical choices.
Migration can also be predicted using sources. If drought, conflict, overcrowding, or job opportunities affect one region more than another, population maps and economic data may suggest where people are likely to move. Predictions are never perfect, but they become more reliable when based on patterns from multiple sources.
How prediction works in geography
Geographic prediction does not mean guessing. It means identifying a pattern, checking it with several sources, and then using that pattern to estimate a likely future outcome. For example, if a city has expanded outward for many years along highways and into flat land, geographers may predict continued growth in those directions unless a physical barrier, policy change, or environmental risk interrupts the pattern.
As shown by the flood-risk planning in [Figure 5], future planning is strongest when people understand both the physical environment and human needs.
A careful geographer separates three levels of thinking. First comes the observation: what the source directly shows. Second comes the inference: what the evidence suggests. Third comes the prediction: what may happen next if the pattern continues.
Suppose a satellite image shows that a lake in Central Asia has become smaller over several years. The observation is the shrinking lake. The inference may be that water use, drought, or changing rivers are reducing the lake's size. The prediction may be that nearby farming, fishing, or communities will face increasing difficulty if the trend continues.
Notice that each level depends on evidence. If a student skips directly to a prediction without first observing and inferring carefully, the conclusion may be weak. Geographers strengthen their thinking by asking: Which sources agree? Which sources add detail? What other explanation might exist?
| Type of thinking | What it does | Example |
|---|---|---|
| Observation | Describes what is directly visible in the source | Most cities on this map are near coasts. |
| Inference | Explains what the evidence suggests | Coastal locations may support trade and transportation. |
| Prediction | Uses evidence to estimate a future outcome | More people may continue moving to coastal cities. |
Table 1. Comparison of observation, inference, and prediction in geographic thinking.
When students form inquiry questions, they should move through these stages. This process keeps the investigation logical, evidence-based, and useful.
One common mistake is asking questions that are too broad. "Why is Asia important?" is far too big. It needs narrowing, perhaps to climate, trade, migration, or urban growth in one region.
Another mistake is relying on only one source. A single map may suggest a pattern, but other sources may explain it better or reveal limits in the first source. For example, a population map may show crowding, but only climate, economic, and transportation data can help explain why.
A third mistake is confusing connection with cause. If two things appear in the same place, that does not automatically mean one caused the other. Geographers must test ideas with evidence from multiple sources before making strong claims.
Earlier geographic skills still matter here: using cardinal directions and map scales, reading map keys, understanding physical and human features, and recognizing regions. Investigating sources builds on those basic skills and pushes them toward deeper explanation.
Careful questioning turns simple map reading into true geographic inquiry. It is the difference between naming a place and understanding how that place works.
This skill can be used in every region of the Eastern Hemisphere. In Europe, students might investigate how rivers and mountain barriers influenced trade and political boundaries. In Africa, they might ask how climate zones shape migration or agriculture. In Asia, they might study urban growth, monsoon climates, river systems, or earthquake risk. In Australia, they might ask how dry interior conditions affect population distribution.
No matter the region, the process stays the same: investigate sources, observe patterns, ask strong questions, compare evidence, make inferences, and predict possible outcomes. The best geographic thinkers do not stop at "what is there?" They continue to "why is it there?", "how has it changed?", and "what may happen next?"