A city block can be hotter than a nearby park, a neighborhood can speak a different first language than the rest of a city, and a river that supports farming in one region can also create flood risk downstream. Geography becomes powerful when we stop looking at places as isolated dots and start seeing patterns. Those patterns are not random. They form because people move, settle, trade, build, adapt, and interact with the environment. They also change depending on the scale at which we study them.
Geographers study spatial patterns, which are the arrangements of people, activities, and environmental features across Earth's surface. A pattern might describe where forests are found, where population density is highest, where drought is spreading, or where specific cultural traditions are most visible. Understanding patterns helps explain why events happen in certain places and what effects they may have on human life and natural systems.
Both cultural characteristics and environmental characteristics can be mapped and compared. Cultural characteristics include language, religion, architecture, land use, transportation networks, and economic activities. Environmental characteristics include climate, topography, vegetation, soils, water systems, and natural hazards. In many geographic questions, these two sets of characteristics are closely linked. For example, dry climates influence crop choices, and mountain barriers may shape language differences by limiting contact between groups.
Spatial pattern refers to the way a feature is arranged across space. Cultural characteristics are human-created or human-shaped features such as beliefs, language, settlement forms, and economic systems. Environmental characteristics are natural features and processes such as climate, landforms, water, and ecosystems.
A major goal in geography is not just to identify where something is, but to explain why it is there, why it differs from place to place, and how patterns shift over time.
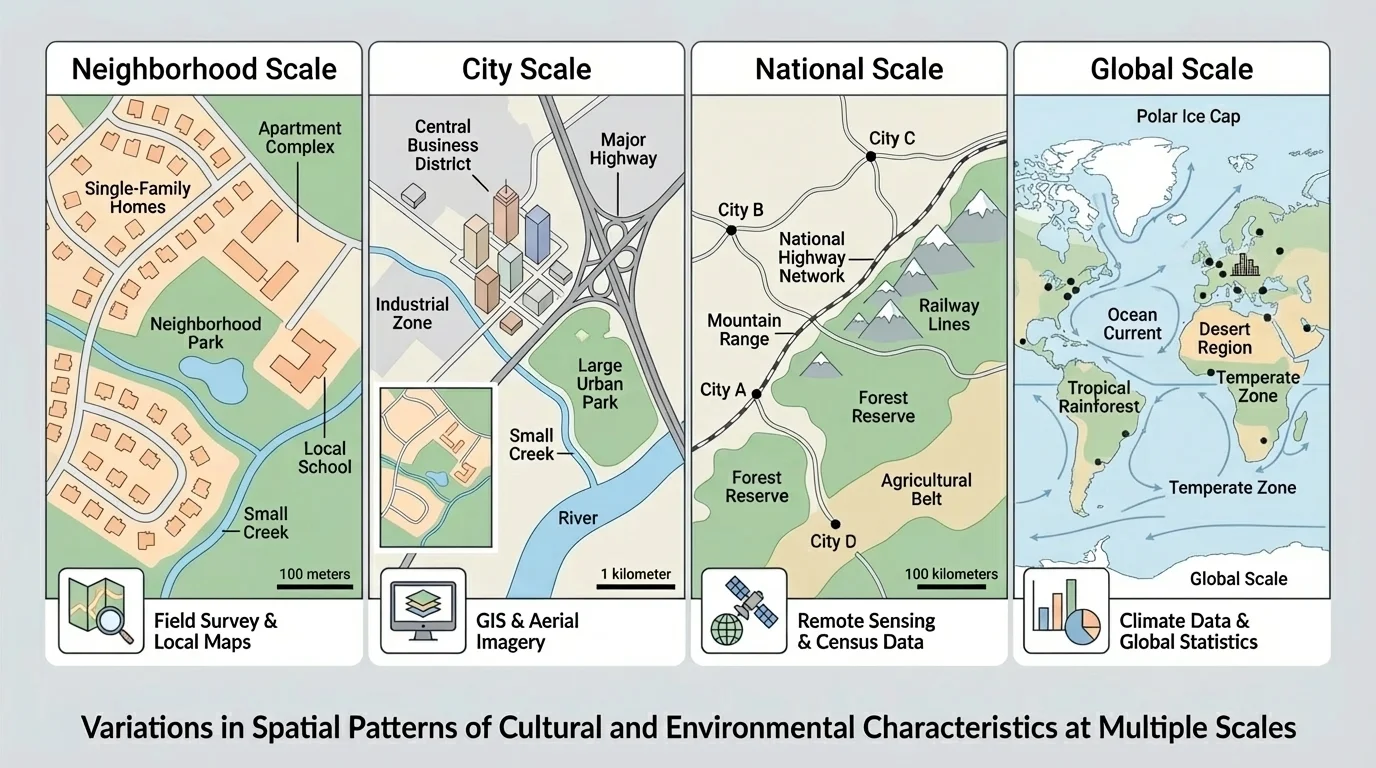
One of the most important ideas in geography is scale. Scale means the level at which a geographic issue is studied: local, regional, national, or global. A pattern can look very different at each level, as [Figure 1] shows. For example, one neighborhood may appear culturally diverse when mapped street by street, while the larger region may seem dominated by one language or one economic activity.
Geographers also describe distribution, or how features are spread out. Distributions may be clustered, dispersed, linear, or uneven. Stores may cluster near highways, settlements may line a river, and rainfall may decrease gradually across a region. Looking at distribution helps geographers detect connections that are not obvious from a list of facts.
Another key idea is that good analysis depends on good evidence. Geographic data comes from multiple valid sources, including topographic maps, thematic maps, satellite imagery, census records, surveys, weather databases, government reports, field observations, graphs, and charts. No single source tells the whole story. Strong geographic analysis compares several sources so that patterns can be checked, refined, and interpreted more accurately.
A map is useful for location and arrangement, but it may not reveal trends over time as clearly as a graph. A chart can compare categories, but it may hide exact spatial relationships. A GIS database can layer multiple variables, but it is only as reliable as the data entered into it. Skilled geographers know how to use each tool for what it does best.
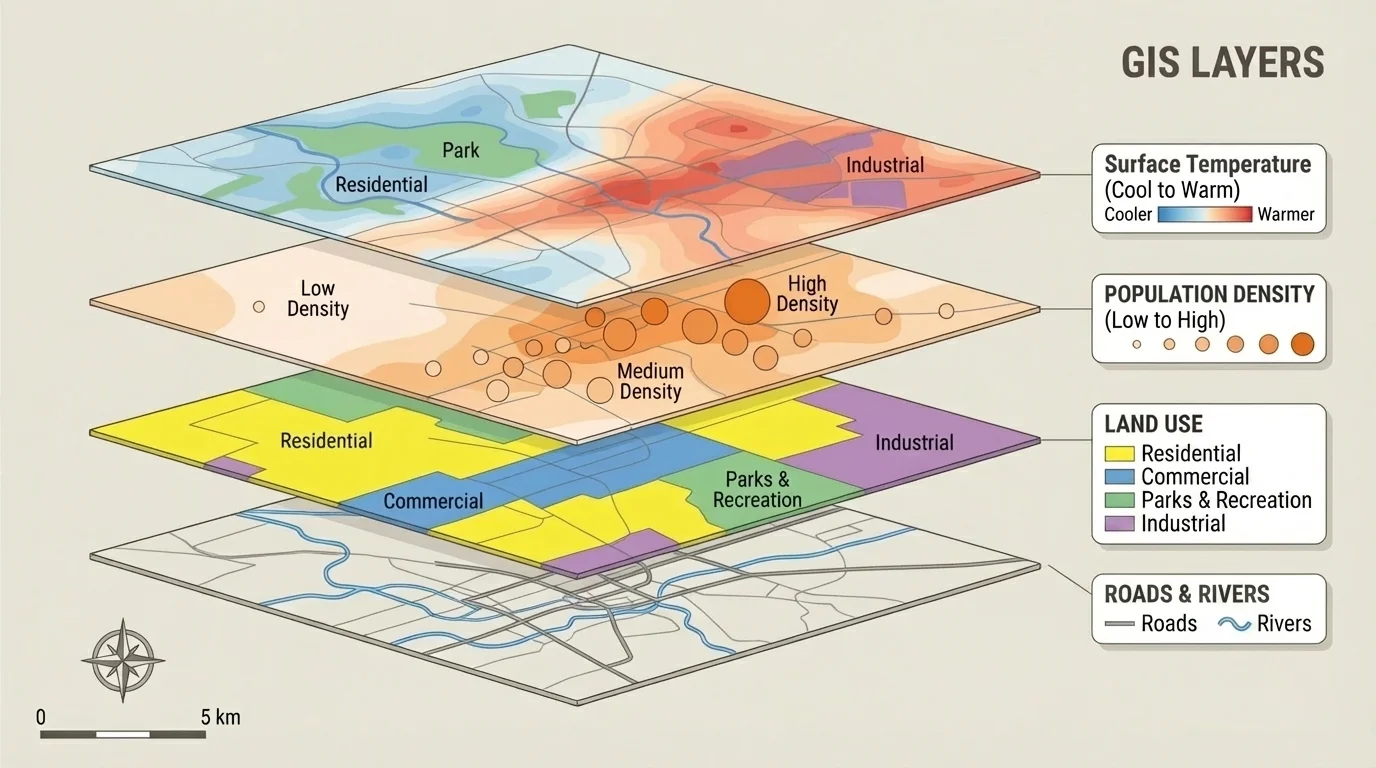
Geographic Information System (GIS) technology is one of the most powerful tools for modern geographic analysis. GIS allows geographers to stack layers of information on the same area. A city map can include layers for roads, land use, income, tree cover, flood zones, and temperature. When those layers are viewed together, new relationships become visible.
[Figure 2] Maps remain essential, but different types of maps answer different questions. A political map shows boundaries and cities. A physical map shows landforms and water features. A topographic map uses contour lines to represent elevation. A thematic map focuses on one topic, such as precipitation, disease rates, or language distribution. Students should always ask: What is this map designed to show, and what does it leave out?
Graphs and charts are equally important because geography is not only visual in space; it is also quantitative. A line graph can show how rainfall changes over the year. A bar chart can compare energy use among countries. A pie chart may show land use categories in a watershed. If a graph shows temperature differences between downtown and suburban areas, it can support a mapped pattern seen in GIS.
Remote sensing adds another dimension. Satellites measure reflected light, heat, moisture, and other properties of Earth's surface. That allows scientists to track deforestation, urban growth, wildfire burn scars, and changing coastlines. Aerial photographs and drone images can also reveal local patterns too small to see at the regional scale.
Fieldwork still matters. Direct observation, interviews, and local surveys can confirm or challenge what appears on a map. For example, census data may identify a neighborhood as multilingual, but field observations might reveal which languages actually appear on storefronts, schools, and public signs.
Why multiple sources matter
Geographic evidence becomes stronger when different sources point to the same conclusion. If a temperature map, a tree-cover dataset, and field observations all show that park areas are cooler than nearby asphalt-covered zones, the pattern is more convincing than if it appeared in only one dataset. This process is sometimes called triangulation—checking one source against others.
Using multiple sources also helps geographers separate appearance from explanation. A map may show where pollution is concentrated, but charts of industrial activity, wind direction, and income levels may help explain why.
Cultural patterns are often easiest to notice at the local scale. In one city, neighborhoods may differ in language use, housing styles, restaurant types, places of worship, and street design. These are visible parts of the cultural landscape, the built and modified environment that reflects human beliefs, history, and economic choices.
At the regional scale, cultural patterns may include broader settlement systems, agricultural traditions, or transportation corridors. For example, parts of the U.S. Great Plains show a regional pattern of large-scale agriculture shaped by climate, flat land, and mechanized farming. In contrast, Mediterranean regions often show patterns of olive cultivation, dense historic settlements, and tourism economies connected to climate and long-term cultural development.
At the national scale, geographers may analyze patterns of internal migration, urbanization, or unequal access to services. A national map might reveal that fast-growing metropolitan areas attract younger populations and more diverse labor markets. Yet this broad pattern can hide major differences between districts inside the same city, which is why geographic analysis must move back and forth between scales.
At the global scale, cultural analysis often focuses on migration networks, trade, language families, religion, communication systems, and globalization. For example, English is used differently across the world: as a first language in some places, an official language in others, and a common second language in international business and science. The pattern is global, but its meaning changes by region and local history.
Some of the world's sharpest cultural boundaries are not marked by walls or official borders. They may be visible through changes in street signs, building materials, land division patterns, or even burial traditions across a short distance.
Geographers must be careful not to treat culture as fixed. Cultural characteristics shift through migration, technology, conflict, trade, education, and environmental change. A place can preserve older traditions while also developing new cultural forms at the same time.
Environmental patterns also change with scale. At the local level, a stream may flood one section of a town while leaving another section dry because of elevation differences, drainage design, and land cover. At the regional level, climate zones shape ecosystems, water availability, and farming systems. At the global level, atmospheric circulation, ocean currents, and climate change create large-scale environmental patterns that connect distant places.
Environmental analysis often considers interactions among landforms, water, vegetation, and human activity. For instance, a watershed can be studied as a physical system, but land use inside that watershed strongly affects erosion, runoff, and water quality. Forest cover usually increases infiltration, while large paved areas often increase surface runoff and flash flooding.
Environmental patterns are commonly measured with maps and data tables. Rainfall can be mapped with isolines. Elevation may be shown on topographic maps. Air quality can be graphed over time. Vegetation cover can be detected from satellite imagery. When these data types are combined, geographers can identify areas of drought stress, habitat fragmentation, wildfire risk, or coastal vulnerability.
| Scale | Example Environmental Pattern | Useful Tools | Main Question |
|---|---|---|---|
| Local | Heat differences between city blocks | GIS, field measurements, land cover map | Why are some blocks hotter than others? |
| Regional | Drought across a farming belt | Climate maps, rainfall graphs, satellite imagery | How is water stress distributed? |
| National | Wildfire risk zones | Hazard maps, vegetation data, weather charts | Which regions face the highest risk? |
| Global | Shifting climate belts | Global climate models, temperature records, maps | How are long-term patterns changing? |
Table 1. Examples of environmental patterns analyzed at different geographic scales.
As with cultural analysis, no single scale gives a complete answer. A global climate trend may explain rising average temperatures, but local tree cover and building materials may explain why one neighborhood feels much hotter than another.
One of the clearest examples of multi-scale geographic analysis is the urban heat island. This pattern occurs when built-up urban areas are warmer than surrounding rural or less-developed areas. The effect can vary from one city to another, but it also varies within the city itself.
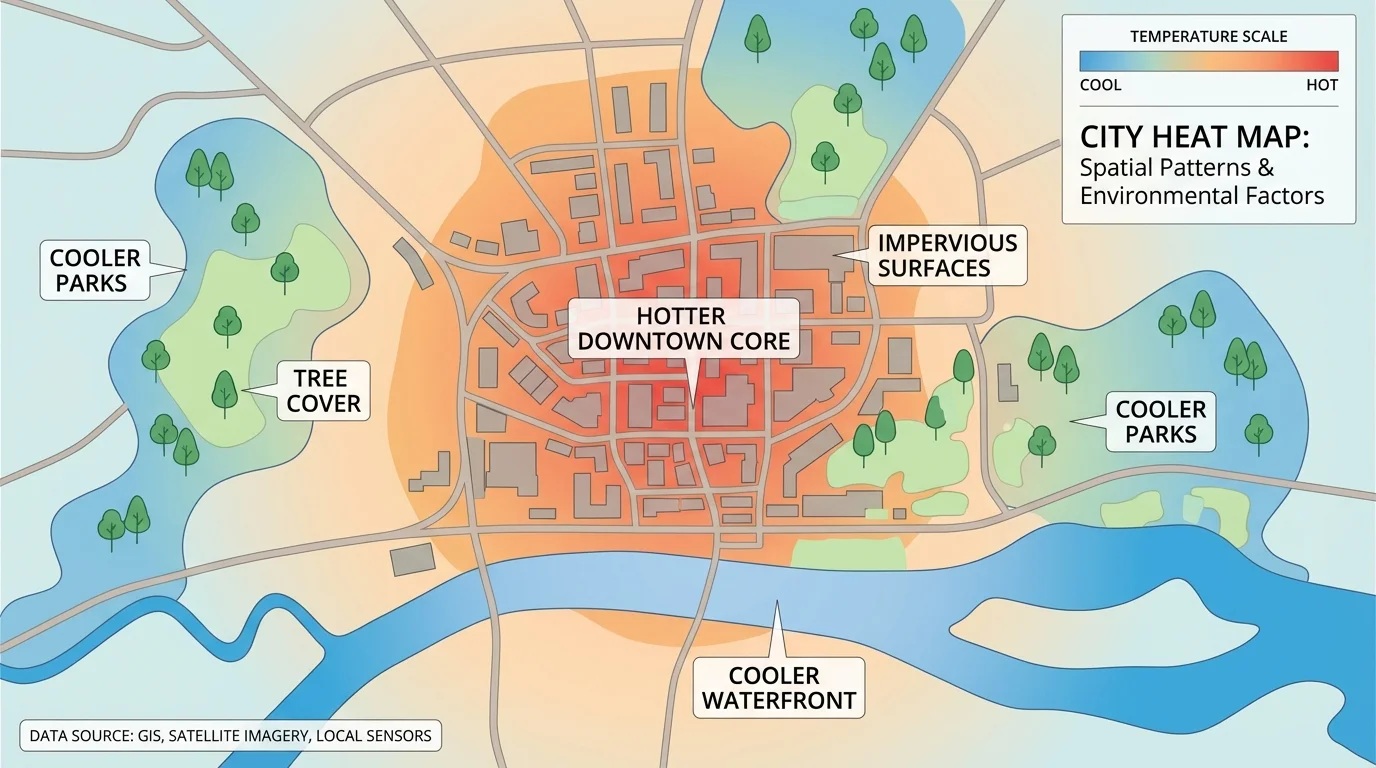
[Figure 3] At the local scale, parking lots, dark roofs, limited vegetation, and dense building materials absorb and re-radiate heat. Parks, lakes, and tree-lined streets often remain cooler. At the metropolitan scale, the downtown core may form a broad zone of higher temperature. At the regional scale, cities in arid climates and cities in humid climates may show different heat island patterns because of vegetation, wind, and moisture differences.
Geographers analyze this issue by combining temperature maps, land cover data, population density, and health information. A graph may show daily temperature peaks, while GIS reveals where the hottest surfaces are located. Public health data may then show that the highest heat exposure often overlaps with neighborhoods that have fewer trees and fewer cooling resources.
Case study example: investigating heat risk in one city
A city planning team wants to identify neighborhoods most vulnerable to extreme summer heat.
Step 1: Map surface temperature
Satellite thermal imagery identifies the hottest parts of the city during afternoon hours.
Step 2: Add environmental layers
GIS layers for tree canopy, parks, water, and impervious surfaces show which landscape features are linked to hotter or cooler conditions.
Step 3: Add human data
Population density, age distribution, and access to air conditioning help reveal which residents face the highest risk.
Step 4: Compare scales
The citywide pattern shows a hot urban core, but neighborhood analysis reveals that some blocks are much hotter than nearby areas because of land cover differences.
This approach helps officials decide where to plant trees, create cooling centers, or redesign streets.
The urban heat island example also shows why geographic issues are rarely only physical or only human. Heat is an environmental pattern, but exposure and vulnerability depend heavily on housing, infrastructure, income, and planning decisions. The same GIS logic seen earlier in [Figure 2] helps reveal these overlapping relationships.
Migration creates cultural patterns that can be studied from multiple scales at once. A single migration flow may begin with environmental stress, economic opportunity, political conflict, or family networks. Once people move, they change the cultural landscape of both the origin and the destination.
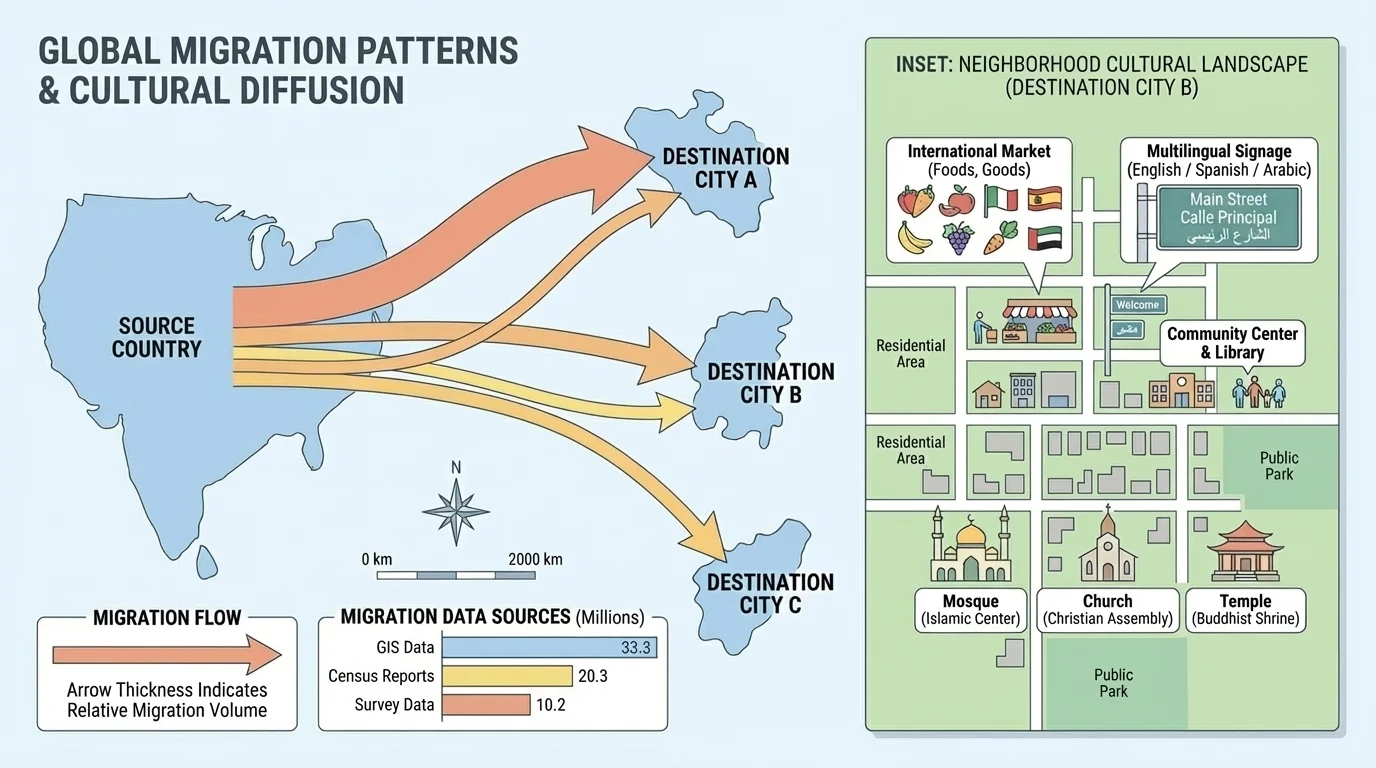
At the neighborhood scale, immigrant communities may shape commercial districts, language use, religious buildings, and restaurants and markets. At the national scale, migration changes labor markets, school demographics, and political debates. At the global scale, the same flow can connect households across continents through remittances, media, transportation, and digital communication.
[Figure 4] Consider migration from rural areas of Mexico to cities in the United States. A local map might show Spanish-language businesses concentrated in certain districts. A regional map might show major transportation corridors and urban destinations. A national chart could show shifts in population over time. A global analysis might connect migration to trade relations, climate pressures, and transnational family networks.
This kind of analysis helps students see that culture is both spatial and dynamic. The visible signs of culture in one place may be linked to forces operating far beyond that place.
Not all geographic data is equally trustworthy. Geographers must evaluate valid sources by asking several questions. Who collected the data? When was it collected? Why was it collected? How was it measured? Does the source have enough detail for the question being studied?
For example, an old population map may not reflect recent migration. Satellite imagery with coarse resolution may miss neighborhood-level patterns. A survey may include bias if some groups were less likely to respond. A graph may exaggerate change if its vertical axis is cut off. Even maps can influence interpretation through color choices, symbol sizes, or projection methods.
Earlier geographic study likely introduced the difference between primary sources and secondary sources. In geography, field notes, interviews, direct measurements, and original satellite data are primary sources. Textbooks, reports summarizing other data, and news articles are usually secondary sources. Both can be useful, but they serve different purposes.
Resolution matters too. A national average can hide local inequality. If one region has average rainfall of about 800 millimeters per year, that does not mean every location within it receives the same amount. Some places may receive much more and others much less. The larger the scale of averaging, the more local variation can disappear.
Map projection is another important limitation. Every flat map distorts something, such as area, distance, direction, or shape. That means global spatial patterns must always be interpreted carefully.
Geographic analysis is not only academic. It supports real decisions. City planners use spatial data to improve transit systems, reduce flood risk, and target tree planting. Public health agencies map disease outbreaks and access to care. Emergency managers track wildfire spread, evacuation routes, and storm impacts. Conservation groups analyze habitat loss and biodiversity hotspots.
Suppose a coastal community faces rising flood risk. A physical map shows low-lying terrain. A hazard map shows storm surge zones. Census data identifies vulnerable populations. Infrastructure maps locate roads, hospitals, and utilities. By combining these sources, leaders can prioritize levees, wetland restoration, evacuation planning, and land-use changes.
Good geographic reasoning also supports fairness. If environmental burdens such as heat, air pollution, or flood exposure are concentrated in some neighborhoods more than others, spatial analysis can reveal those inequalities. The hot-spot pattern seen in [Figure 3] is not only a climate issue; it may also be an issue of public investment and access to environmental benefits.
"The map is not the territory."
— A reminder that every map is a selective representation of reality
This principle matters because geographic tools are powerful, but they do not replace judgment. A map can reveal a pattern, yet geographers must still interpret what that pattern means and what other evidence is needed.
Strong geographic conclusions are specific, evidence-based, and scale-aware. Instead of saying, "cities are hotter," a stronger statement would be: "In this metropolitan area, surface temperatures are highest in dense commercial districts with extensive impervious surfaces and limited tree canopy, while cooler zones cluster around parks and waterfronts." That statement identifies a pattern, a location, and a likely explanation.
Geographers also compare scales before reaching conclusions. A national trend in migration may be real, but local neighborhoods can experience it very differently. A regional drought pattern may be broad, but water shortages can be sharper in some watersheds than others. The multi-scale map pattern introduced earlier in [Figure 1] remains essential: what you see depends partly on the level at which you look.
Finally, good geographic analysis synthesizes cultural and environmental evidence rather than treating them separately. Human choices shape the environment, and environmental conditions shape human possibilities. The best geographic investigations ask how these influences interact across space and over time.