A desert can be hot and dry for years, while a rainforest can be warm and rainy almost every day. How do we know that these patterns are real and not just one person's guess? Scientists and students learn about the world by collecting information from more than one source. When we read a book, study a map, watch a trustworthy science video, and look at weather data, we can put those pieces together like a puzzle. That helps us explain natural events and patterns more clearly.
Learning to gather and combine information is an important science skill. It helps us answer questions such as: Why is one place snowy for much of the year? Why do some places get heavy rain? Why do farmers in different regions grow different crops? Good explanations come from evidence, not from guessing.
One source can teach us something useful, but it may not tell the whole story. A book might explain a region's average rainfall. A climate map might show where that region is. A graph might show temperatures across many years. A news report from a science organization might tell how people are affected by drought or storms. When we combine information from these sources, we understand the phenomenon better.
A phenomenon is something that happens in nature and can be observed, such as rain, wind, drought, floods, or long-term climate patterns. To explain a phenomenon well, we need facts that fit together. If one source says a place is dry, another source might show very low yearly rainfall, and a map might show that the place lies near a desert. Together, those facts make a stronger explanation.
Reliable source means a source that gives accurate information based on evidence. Reliable sources often come from scientists, teachers, museums, science books, educational websites, weather services, and organizations that check facts carefully.
Evidence is information that helps support an idea or explanation. Evidence can include measurements, observations, maps, photos, and records collected over time.
Using more than one source also helps us check whether the information matches. If two or three trustworthy sources agree, we can feel more confident. If the sources disagree, we may need to look more carefully, check the date, or find out which source has stronger evidence.
Media are channels through which information is shared. Media can include books, maps, charts, articles, videos, audio reports, and websites. Some media are more trustworthy than others. A science encyclopedia, a government weather website, or a museum video is usually more reliable than a random post online.
To decide whether a source is reliable, ask a few important questions. Who made it? Is the author a scientist, teacher, or expert group? When was it made? Newer information may include better measurements. What evidence does it use? Does it show facts, data, or observations? Does it match other reliable sources? Good science information can usually be checked in more than one place.
Some climate records come from measurements collected over many decades. That means the explanation of a place's climate is not based on one rainy day or one hot afternoon, but on patterns seen again and again over time.
Pictures and videos can be useful, but they should also come from trusted places. A video of a snowstorm does not prove that a whole region always has snowy winters. For that, we would also want long-term records, maps, and written explanations.
Weather is what the air is like over a short time, such as today or this week. It can be sunny, cloudy, rainy, windy, hot, or cold. [Figure 1] Climate is the pattern of weather in a place over a long time, often many years. If a place is usually warm and rainy year after year, that is part of its climate.
Think of weather as a single page in a diary and climate as the whole diary. One snowy day does not make a place polar. One hot day does not make a place tropical. Scientists study many observations over time before describing the climate of a region.
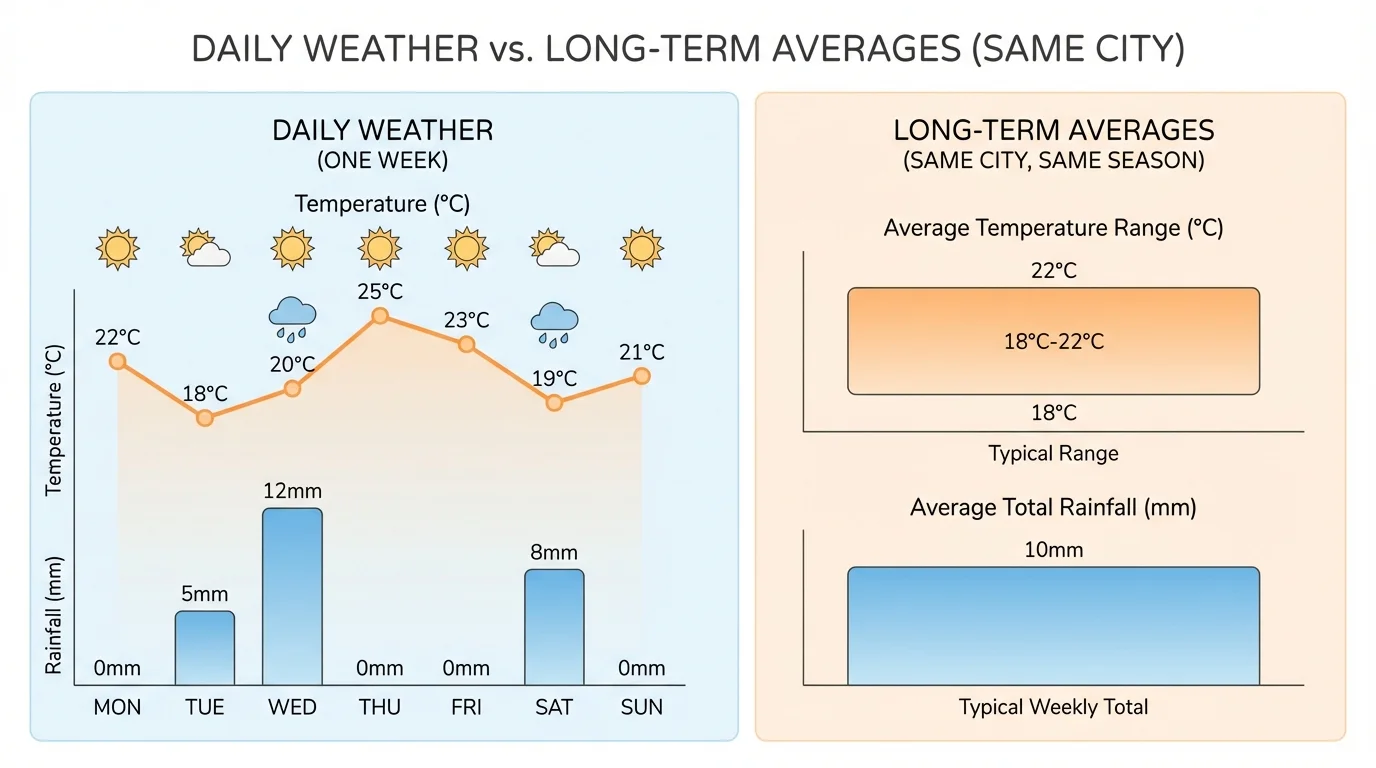
Climate patterns are often described using things like average temperature and average rainfall. For example, if a place gets about \(100 \textrm{ cm}\) of rain in a year and stays warm most months, that suggests a wetter, warmer climate than a place that gets only \(20 \textrm{ cm}\) of rain and has colder winters. These numbers are not the whole story, but they are important clues.
When students obtain information from several reliable sources, they can separate short-term weather events from long-term climate patterns. That is important because people make decisions about crops, houses, water use, and clothing based on climate, not just on a single day's weather.
[Figure 2] Different parts of Earth have different climate patterns, and a world map helps us see those regions clearly. Places near the equator are often warmer because they receive more direct sunlight during the year. Places closer to the poles are colder because sunlight reaches them at a lower angle.
One major region is the tropical region. Tropical places, such as parts of Brazil, the Congo Basin in Africa, and Indonesia, are usually warm all year and often get a lot of rain. Rainforests grow well there because plants have plenty of warmth and water.
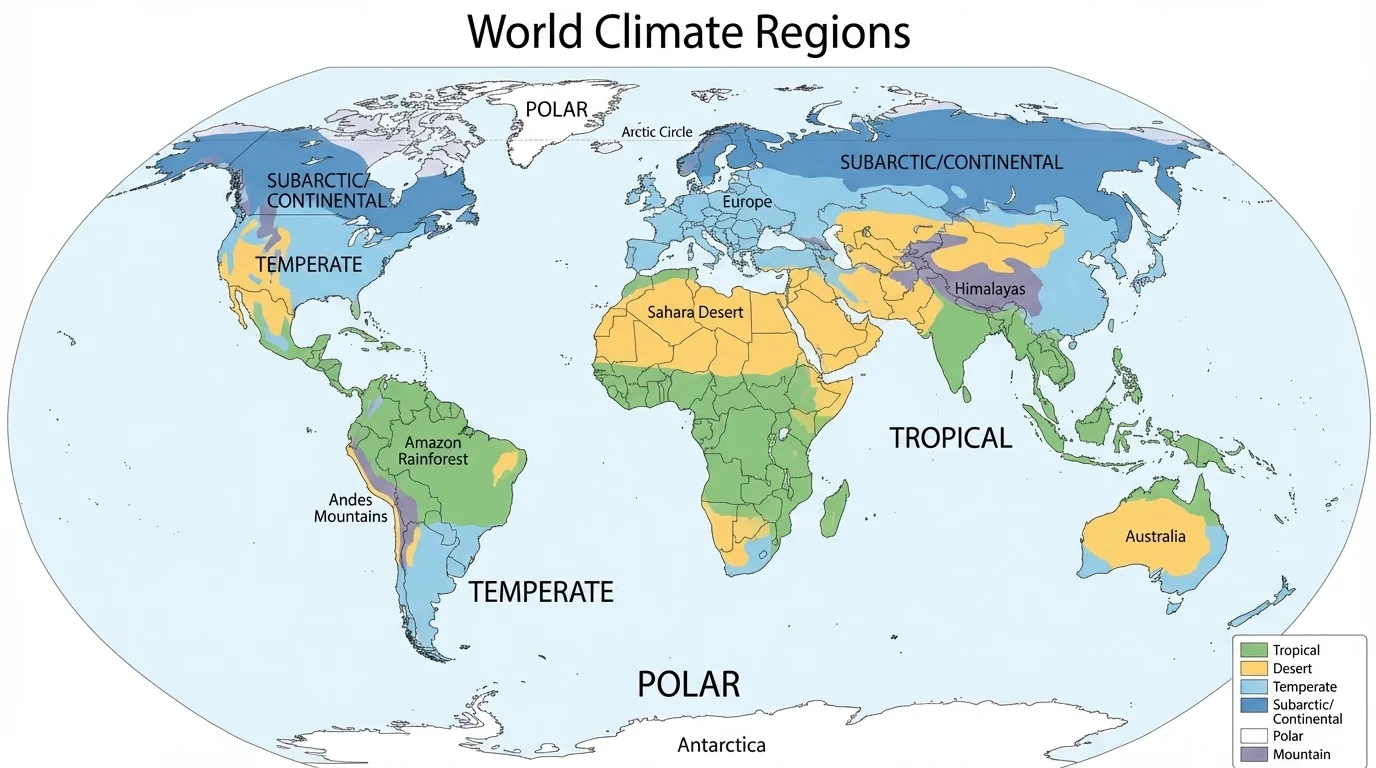
Another type is the desert climate. Deserts such as the Sahara in Africa and parts of Australia receive very little rainfall. Many deserts are hot during the day, but some can become quite cold at night. Because water is scarce, plants and animals there have special ways to survive.
Temperate regions often have seasons such as warm summers and cool or cold winters. Many parts of the United States, Europe, China, and New Zealand have temperate climates. Rainfall may be spread through the year or may be greater in certain seasons.
Polar regions, such as Antarctica and the Arctic, are very cold for much of the year. These places receive less direct sunlight, especially in winter. Ice and snow are common, and only certain living things can survive those conditions.
Mountain regions can also have special climates. Higher places are usually colder than lower places nearby. A mountain may even have snow at the top while valleys below are much warmer. We return to this idea later when we use mountains to explain why one side of a region may be wetter than another.
| Region | Typical Temperature Pattern | Typical Rainfall Pattern | Example Places |
|---|---|---|---|
| Tropical | Usually warm all year | Often high rainfall | Amazon, Congo Basin, Indonesia |
| Desert | Can be very hot or sometimes cool | Very low rainfall | Sahara, Arabian Desert, central Australia |
| Temperate | Seasons with warmer and cooler parts of the year | Moderate rainfall | Much of Europe, eastern United States |
| Polar | Very cold much of the year | Low precipitation, often snow | Arctic, Antarctica |
| Mountain | Cooler at higher elevations | Varies by slope and height | Andes, Rockies, Himalayas |
Table 1. Major climate regions, their general patterns, and example places.
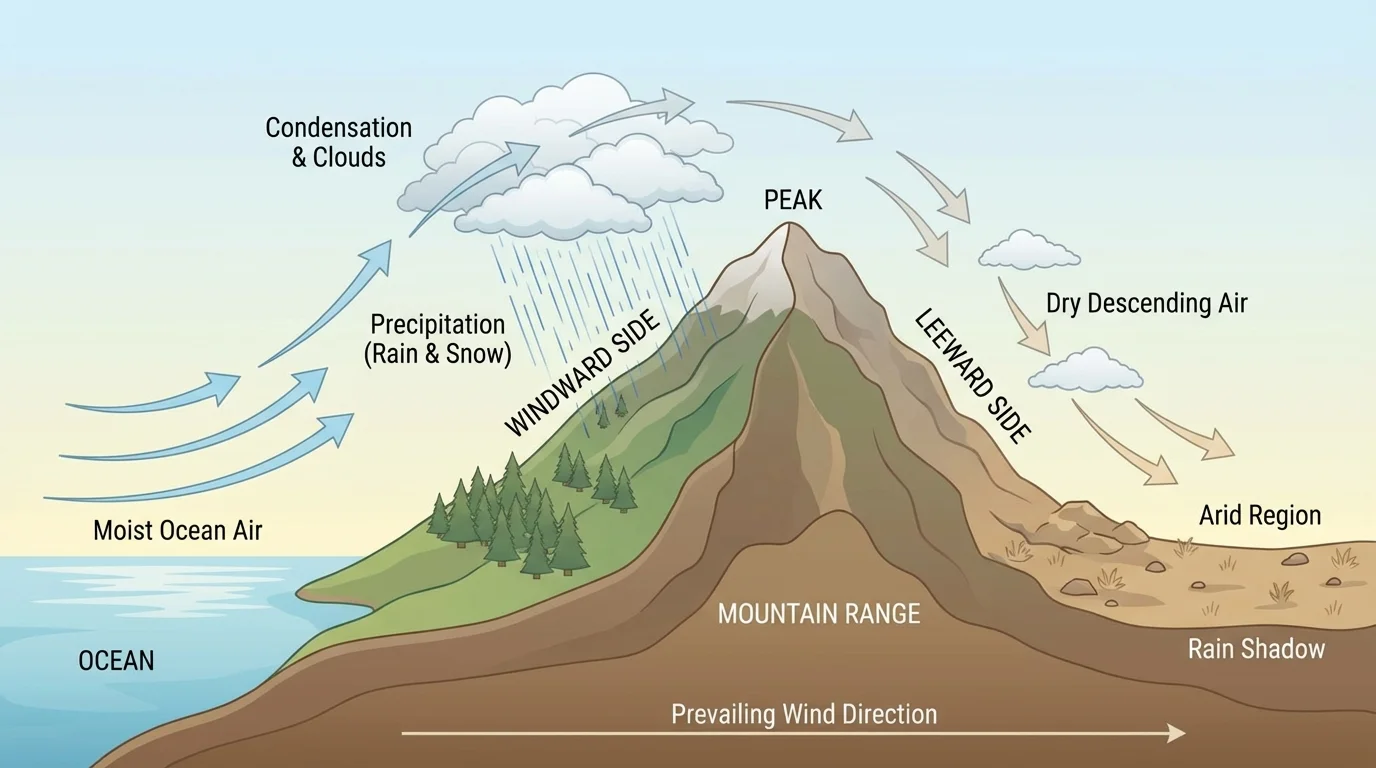
[Figure 3] Climate is shaped by Earth's systems working together, and this diagram illustrates one important example. The atmosphere is the layer of air around Earth. The oceans, lakes, rivers, land, ice, and living things also matter. Sunlight warms Earth, water moves through the water cycle, air moves as wind, and landforms such as mountains change how air and water travel.
The Sun provides energy that warms Earth's surface. Water from oceans, lakes, and rivers can evaporate into the air. Later, it can form clouds and fall as rain or snow. This movement of water helps explain why some places are wet and others are dry.
Mountains are especially important. When moist air moves in from an ocean and hits a mountain, the air rises. Rising air cools, and water can fall as rain or snow on one side of the mountain. The other side may be much drier because less moisture remains in the air.
Oceans also help shape climate because water warms and cools more slowly than land. A place near the ocean may have milder temperatures than a place far inland. That means summers and winters may not be as extreme near a coast. As we saw in [Figure 2], climate regions on maps are not arranged by chance. They connect to sunlight, water, air movement, and landforms.
How systems work together
No single part of Earth decides a region's climate by itself. Sunlight, moving air, water, land shape, and location all interact. A good explanation usually connects several causes instead of naming only one.
This is why scientists collect information from different kinds of sources. A map may show mountains. A book may explain how air cools as it rises. Rainfall records may show that one side of the mountain is wetter. When those pieces agree, the explanation becomes much stronger.
[Figure 4] Scientists and students often follow a process: ask a question, gather information from reliable sources, compare what the sources say, combine the evidence, and then write or tell an explanation. This method helps us move from facts to understanding.
Suppose the question is, "Why is one city rainy and another city dry?" First, we gather sources. We might use a textbook, a climate map, average rainfall data, and a trusted weather website. Next, we compare them. Do they all show low rainfall in one city? Do they all place the rainy city near an ocean or mountain?
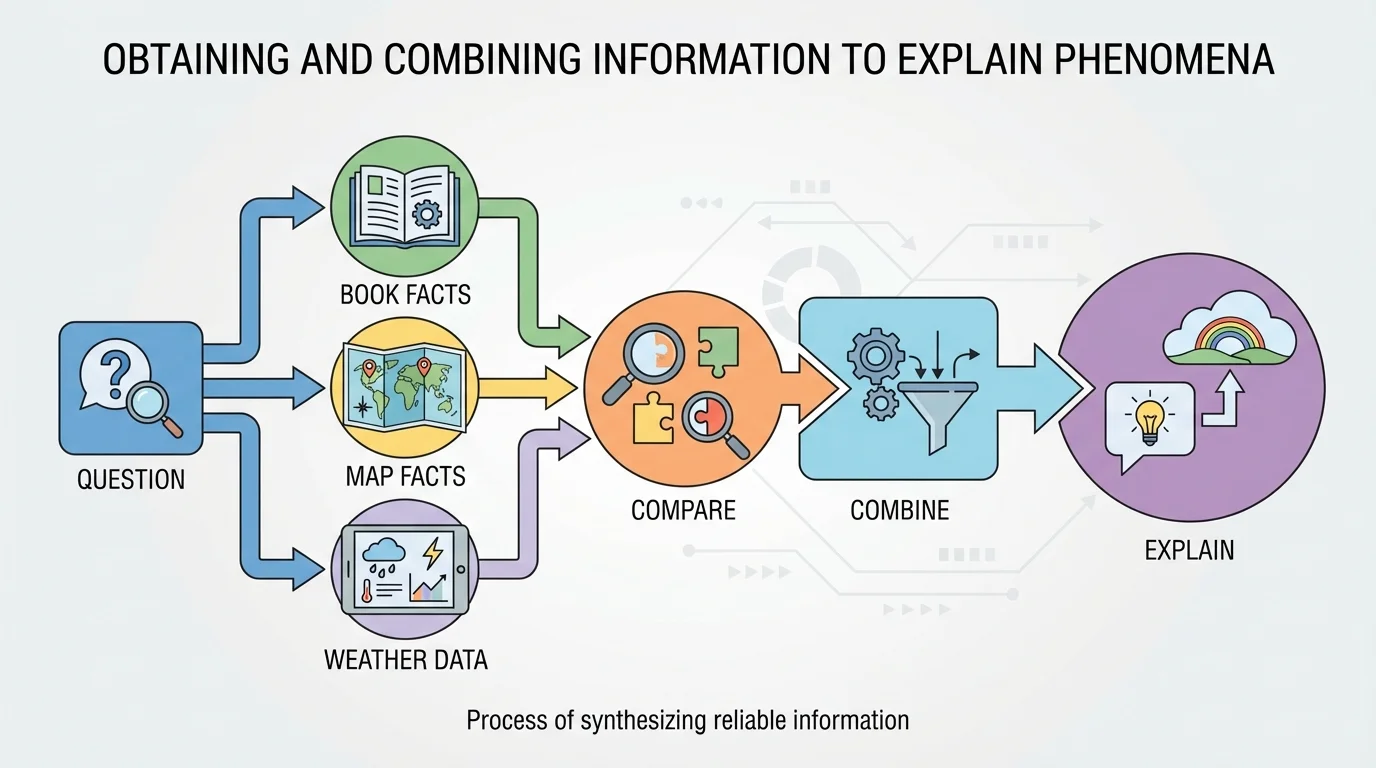
Then we combine the facts into one explanation. Instead of saying only, "It is dry because it does not rain much," we explain why the rainfall is low. Maybe the city is in a desert region. Maybe mountains block moist air. Maybe it is far from large bodies of water. Combining information helps us explain causes, not just results.
Example: combining sources to explain a dry climate
Step 1: Read a book source.
The book says the region is in a desert belt and receives about \(25 \textrm{ cm}\) of rain each year.
Step 2: Check a map source.
The map shows mountains between the region and the ocean.
Step 3: Check weather data.
The data show hot temperatures and very low rainfall in most months.
Step 4: Combine the information.
A strong explanation is that the region has a dry climate because it lies in a desert area, gets little yearly rainfall, and mountains block moist ocean air.
This kind of explanation is stronger because it uses several pieces of evidence that support one another. As shown earlier in [Figure 3], landforms can change where rain falls, so a map can be just as important as a paragraph in a book.
Let's compare two places: a tropical rainforest region and a desert region. A rainforest area near the equator often gets strong sunlight, warm temperatures, and plenty of water in the air. Books may explain that warm air rises and helps clouds form. Climate graphs may show heavy rainfall during many months. Satellite images may show thick green forests.
A desert region has different conditions. Reliable sources may show very low average rainfall, dry winds, or mountains that block moisture. The ground may have sparse plant life because there is not enough water for many large plants to grow.
When we put these sources together, we can explain the difference: the rainy region has conditions that help water enter the air and return as rain, while the dry region has conditions that limit rainfall. The explanation is not based on one photograph or one sentence. It comes from combined evidence.
You may already know that water changes form in the water cycle: liquid water can evaporate, become water vapor, form clouds, and fall as precipitation. Climate patterns depend a lot on where and how often this cycle happens in a region.
Students can use the same skill for many science questions. Why does snow stay longer in some mountains? Why are coastlines often milder than inland places? Why do some areas have rainy seasons? In each case, the best answer comes from gathering and combining information carefully.
Climate information is useful in everyday life. Farmers need to know when rain usually falls and how warm the seasons are. Builders need to know whether houses should be designed for deep snow, heavy rain, strong winds, or extreme heat. Communities need to know whether they should save water during dry times or prepare for flooding in rainy times.
People also adapt to climate in simple ways. Clothing, food crops, and outdoor activities often fit local conditions. A family in a cold region may need thick coats and strong heating. A family in a hot, dry region may need shade, cool buildings, and careful water use.
Some schools use local weather and climate data to decide when students need extra water breaks, indoor recess during storms, or clothing reminders during cold seasons.
Using reliable information can help people protect natural resources too. If a region often has little rainfall, people may store water, plant crops that need less water, or protect soil from drying out. Good decisions begin with good information.
After combining information, it is important to check whether the explanation really fits the evidence. Ask: Does every source come from a trustworthy place? Do the facts agree? Does the explanation connect causes and effects? Did I use enough evidence?
A weak explanation might say, "This place is cold because it snowed there." A stronger one says, "This place has a cold climate because long-term temperature records show cold winters, its location is closer to the poles, and reliable maps and data show snow and ice are common there." The second explanation uses several sources and shows how the facts connect.
Sometimes explanations can improve when new data are collected. Science is not just about finding one answer and stopping. It is also about checking evidence, asking questions, and improving explanations when we learn more.
"The more carefully we observe, the better we understand."
That idea is especially true when we study climate patterns across the world. Careful observation, trustworthy sources, and combined evidence help us explain Earth's amazing variety of environments.