A soup pot boils, an ice cube melts, sugar disappears in water, and pancake batter changes as it cooks. These changes may look very different, but they all connect to one powerful science idea: matter is conserved. That means matter does not simply vanish during these changes. If scientists measure carefully, they can show that the total weight stays the same even when a substance changes form or gets mixed with something else.
Scientists and engineers do not just guess what is happening. They measure, record data, and make graphs. Those graphs help them see patterns and use evidence to answer questions. If the total weight changes, they do not jump to a conclusion right away. Instead, they ask whether some matter escaped, whether the tool was used correctly, or whether the system was not closed.
In science, matter is anything that has mass and takes up space. Water, air, salt, metal, and wood are all matter. When matter changes, it may melt, freeze, dissolve, or mix. It may even seem to disappear. But if we include all the material in the investigation, the total amount of matter stays the same.
This idea is called conservation of matter. For grade-level investigations, we often look at it through weight. If a sealed container with water and ice weighs \(120 \textrm{ g}\) before the ice melts, it should still weigh \(120 \textrm{ g}\) after it melts. The form changes, but the total matter does not.
Weight is a measure of how strongly gravity pulls on matter. In school science investigations, students often discuss weight when reading a scale, while a balance is used to compare mass in grams or kilograms.
System means the materials you are studying. A closed system keeps matter from getting in or out, while an open system allows matter to leave or enter.
If you leave the lid off a cup of water and some water evaporates into the air, the cup may weigh less later. That does not mean matter was destroyed. It means some matter left the system you were measuring. To test conservation of matter fairly, scientists try to measure a closed system.
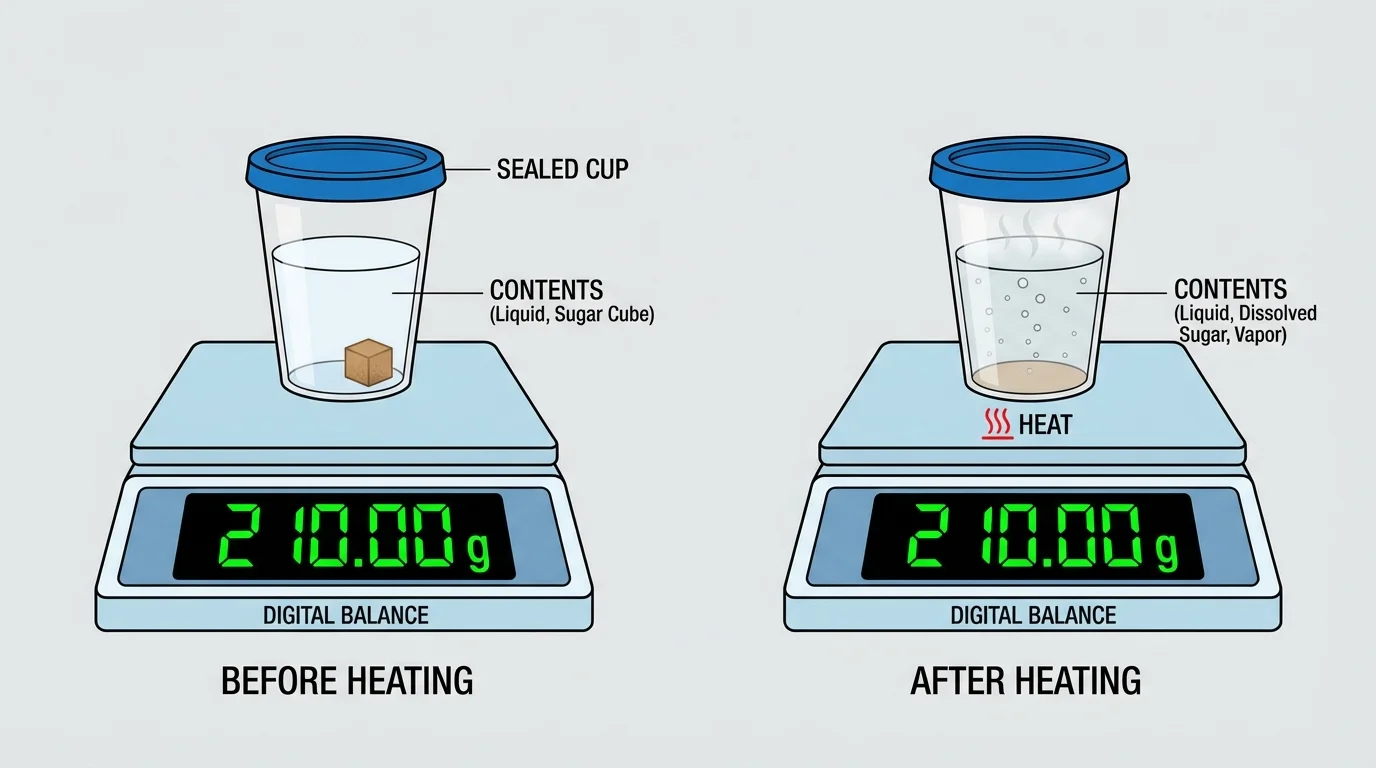
A balance or scale gives evidence about how much matter is present. As [Figure 1] shows, scientists can compare the total weight of a container and everything inside it before and after a change. If the reading stays the same, that is evidence that the total matter is conserved.
In grade 5 science, the most common units are grams and kilograms. A paper clip might weigh about \(1 \textrm{ g}\), while a backpack might weigh several kilograms. Since \(1 \textrm{ kg} = 1{,}000 \textrm{ g}\), a container measured as \(250 \textrm{ g}\) could also be described as \(0.25 \textrm{ kg}\).
When measuring, students should place the object gently on the balance, wait for the reading to settle, and record the number with the correct unit. If a cup and its contents weigh \(86 \textrm{ g}\) before mixing and \(86 \textrm{ g}\) after mixing, the evidence supports the idea that no matter was lost.
Sometimes students hear both mass and weight. In everyday school investigations, the reading on a balance is often used to compare amounts of matter, even if people casually call it weight. The key idea here is not the exact word choice but the evidence: the total measured amount stays the same when all matter is included.
You already know that solids, liquids, and gases are forms of matter. A substance can change state, such as from solid to liquid, without becoming a different kind of matter.
A good measurement also needs the same conditions each time. If the container is dry before the first measurement but wet on the outside during the second, the reading may change. If the object touches the table while on the balance, the reading will be wrong. Careful setup matters.
A fair test changes only one variable at a time and keeps other conditions the same. If you want to know whether heating changes total weight, then use the same container, the same amount of material, and the same balance before and after heating. This makes the investigation more reliable.
Scientists often repeat measurements. Suppose a sealed cup of warm water is measured three times and gives \(152 \textrm{ g}\), \(152 \textrm{ g}\), and \(151 \textrm{ g}\). Those readings are very close. A tiny difference may happen because of tool limits or reading mistakes. The data still suggest that the total weight stayed about the same.
Accuracy improves when students zero the balance, use the same container each time, and record data immediately. If the investigation includes a lid, the lid must stay with the container during every measurement. If even a drop spills out, the system changes.
A tiny amount of spilled liquid can change a measurement enough to confuse the results. That is why laboratory scientists pay close attention to lids, seals, and clean containers.
Another important idea is to measure the whole system. If you only weigh the liquid and forget the container, that can still work if you do it the same way both times. But if crystals stick to the lid or steam collects on the side and you do not include those parts, your evidence will be incomplete.
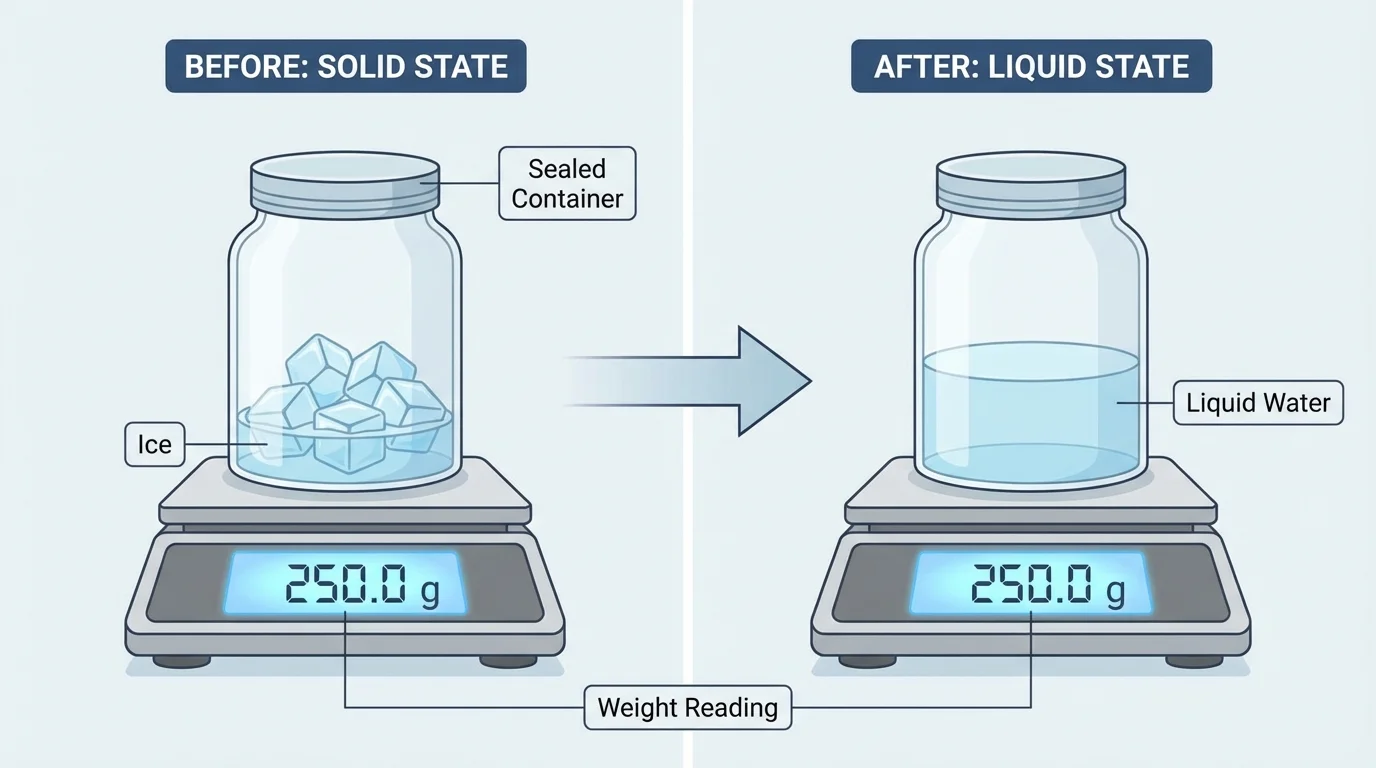
Heating and cooling often make matter look very different. As [Figure 2] illustrates, ice can melt into liquid water in a sealed container, yet the total measured weight stays the same because it is still the same matter in the system.
Suppose a sealed bag containing ice and water weighs \(200 \textrm{ g}\) before the ice melts. After sitting in a warm room, all the ice becomes liquid water. If the system stays sealed, the bag should still weigh \(200 \textrm{ g}\). The state changed, but the amount of matter did not.
The same reasoning works for cooling. If liquid water in a sealed container is placed in a freezer, it becomes solid ice. If the reading was \(175 \textrm{ g}\) before freezing, it should remain \(175 \textrm{ g}\) after freezing. The shape and state may change, but the total weight is conserved.
Evaporation can be trickier because water vapor may leave an open container. If a cup of water weighs \(90 \textrm{ g}\) at first and later weighs \(83 \textrm{ g}\), that does not prove matter disappeared. It shows that the measured system changed because some water entered the air as gas. If the cup had been sealed, the total weight of the cup plus water vapor would still be expected to stay the same.
Why heating does not destroy matter
Heating gives particles more energy, so they may move faster or spread farther apart. Cooling removes energy, so particles may move more slowly or pack closer together. These changes can change state, but they do not erase the particles themselves.
Later, when you compare melting and evaporation, remember the difference between a closed and open system. That difference explains why a graph might show equal weights in one investigation but different weights in another.
When substances mix, one of them may seem to disappear. A common example is salt stirred into water. The salt is still there even though you cannot see the grains. If a cup with water and salt weighs \(110 \textrm{ g}\) before stirring, it should still weigh \(110 \textrm{ g}\) after the salt dissolves, as long as no water splashes out.
Dissolving is a kind of physical change. The particles of salt spread through the water, but the total amount of matter remains the same. This is one reason measuring is so helpful. Your eyes may say the salt vanished, but the balance says the matter is still present.
Example: Mixing sugar into water
A cup and its contents are measured before and after sugar is stirred into water.
Step 1: Measure before mixing.
The cup, water, and sugar together weigh \(95 \textrm{ g}\).
Step 2: Stir until the sugar is no longer visible.
The sugar dissolves, but it remains part of the system.
Step 3: Measure again.
The cup and mixture still weigh \(95 \textrm{ g}\).
The evidence shows that dissolving did not change the total weight of matter.
Mixing can also help answer engineering questions. If a company seals a drink powder inside a packet, engineers want to know whether the packet keeps all the material inside during shipping. Measuring packets before and after shaking or warming can reveal leaks.
Some mixtures produce gas. For example, combining vinegar and baking soda can make bubbles. If that happens in an open container, some gas escapes into the air, so the measured cup may weigh less afterward. In a sealed container, the total weight of the whole system should still stay the same because the gas remains inside.
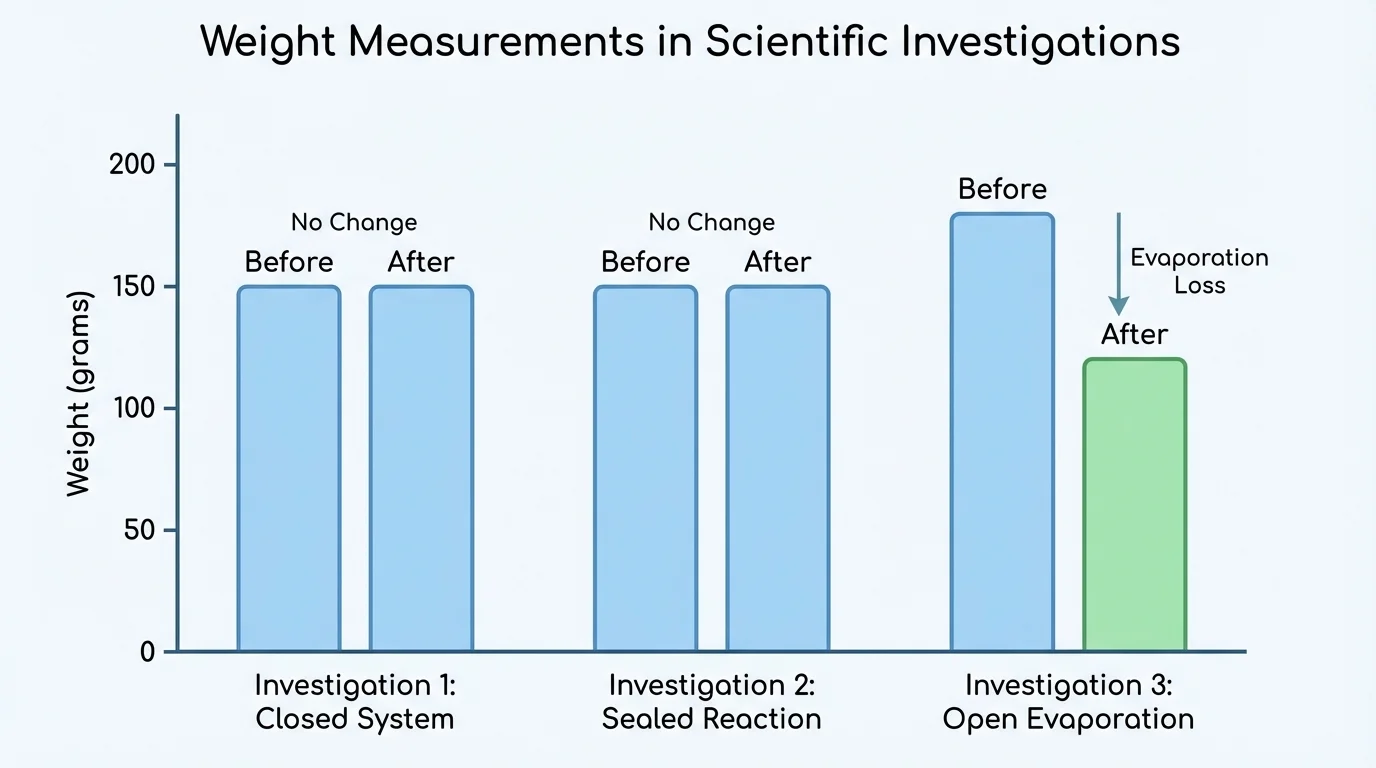
[Figure 3] Numbers are easier to understand when they are organized. Scientists record measurements in a data table so they can compare results clearly. A table often includes the investigation name, the weight before the change, the weight after the change, and notes about whether the system was open or closed.
Graphs turn those numbers into visual evidence. A bar graph can quickly reveal whether the "before" and "after" weights match. Equal bar heights suggest that the total weight stayed the same. Different heights tell scientists to ask whether matter left the system or whether there was a measurement problem.
| Investigation | Before | After | System type |
|---|---|---|---|
| Ice melting in sealed bag | \(200 \textrm{ g}\) | \(200 \textrm{ g}\) | Closed |
| Salt dissolving in water | \(110 \textrm{ g}\) | \(110 \textrm{ g}\) | Closed |
| Open cup of water evaporating | \(90 \textrm{ g}\) | \(83 \textrm{ g}\) | Open |
Table 1. Comparison of before-and-after weights for three investigations involving changes in matter.
To make a bar graph, place the investigation names on one axis and the measured weights on the other axis. Then draw one bar for "before" and one bar for "after" for each investigation. Matching pairs are easy to spot.
You can also compare values by subtraction. For the open cup of water, the change is \(90 \textrm{ g} - 83 \textrm{ g} = 7 \textrm{ g}\). That means \(7 \textrm{ g}\) of matter left the measured cup system. For the sealed bag of melting ice, the change is \(200 \textrm{ g} - 200 \textrm{ g} = 0 \textrm{ g}\), so the evidence supports conservation of matter.
Example: Reading a graph
A graph shows that a sealed container has a before weight of \(140 \textrm{ g}\) and an after weight of \(140 \textrm{ g}\).
Step 1: Compare the two values.
The bars are equal, so \(140 \textrm{ g} = 140 \textrm{ g}\).
Step 2: Decide what that means.
The total measured weight did not change.
Step 3: Write a claim supported by evidence.
The graph provides evidence that the total matter in the sealed system was conserved during the change.
Graphs do not do the thinking by themselves. Scientists still have to explain the pattern. A graph is strongest when it is combined with careful measurement and a clear description of the system.
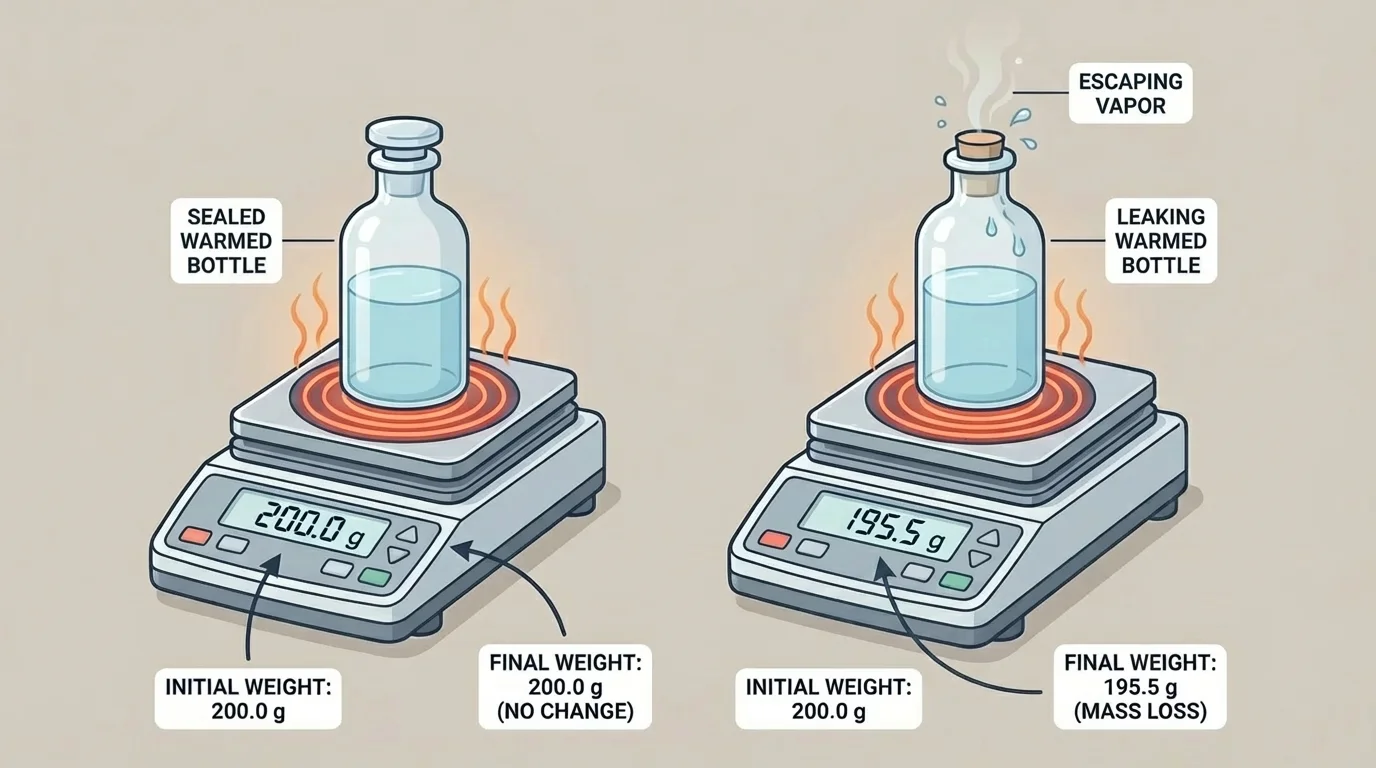
Measurement and graphing help answer practical questions, not just classroom questions. As [Figure 4] shows, if one sealed bottle loses weight after warming while another does not, engineers can use that evidence to suspect a leak or poor seal rather than loss of matter from nowhere.
Suppose two identical bottles each start at \(300 \textrm{ g}\). After being warmed, Bottle A still weighs \(300 \textrm{ g}\), but Bottle B weighs \(294 \textrm{ g}\). The change for Bottle B is \(300 \textrm{ g} - 294 \textrm{ g} = 6 \textrm{ g}\). That evidence suggests some matter escaped from Bottle B.
This kind of reasoning is useful in designing food containers, medicine bottles, and packages for liquids. Engineers need products that keep matter inside when they are supposed to. A weight graph can help test which design works best.
We can also use evidence to respond to a scientific claim. If someone says, "The sugar disappeared, so it must be gone," you can answer with data. If the total measured weight was the same before and after dissolving, the evidence shows the sugar is still part of the mixture. That connects back to the equal bars we saw in [Figure 3] for closed systems.
"Good measurements turn ideas into evidence."
Evidence-based thinking means asking: What was measured? Was the system closed? Was the tool used correctly? Was the data recorded clearly? These questions help us avoid wrong conclusions.
Cooking uses this idea all the time. A baker may weigh ingredients before mixing them. Even when flour, water, oil, and sugar turn into dough, the total amount of matter is still there unless some spills out or escapes as gas or steam. Careful weighing helps bakers make the same recipe successfully again and again.
Recycling centers sort and weigh materials such as paper, plastic, and metal. Factories weigh raw materials before making products. Water treatment plants track how much material enters and leaves different steps. In all of these cases, measurement helps people monitor matter and solve problems.
Scientists in laboratories use sealed containers when they want to track total matter during reactions or state changes. They graph results to communicate what happened. A graph can show patterns much faster than a long list of numbers, especially when several investigations are compared at once.
Why graphs matter in engineering
Engineers often test several designs and compare their data side by side. A graph helps them see which design keeps the total weight constant, which suggests that the design prevents leaks and works more effectively.
When you understand how to measure and graph weight, you are using the same kind of evidence that real scientists and engineers use. You are not only learning to read numbers. You are learning how to make a claim, test it fairly, and support it with data.