Your body is constantly solving problems you barely notice. When you run up stairs, your heart rate rises. When you step into cold air, your muscles may shiver. When blood sugar changes after a meal, hormones help bring it back into range. None of this happens randomly. These are examples of biological systems maintaining internal balance, and scientists study them by designing investigations that produce strong evidence, not just interesting observations.
In science, a good investigation is more than "doing an experiment." It is a carefully planned process for collecting data that are trustworthy enough to answer a question. If the design is weak, the evidence is weak. If measurements are sloppy, the conclusion may be wrong even if the idea seems reasonable. That is why scientists must decide what data to collect, how many measurements are needed, how accurate the tools must be, and what limits—such as time, risk, or cost—could affect the quality of the investigation.
Biology provides powerful examples because living things constantly use homeostasis, the maintenance of relatively stable internal conditions. To investigate homeostasis, students might measure changes in pulse rate during exercise, monitor skin temperature before and after exposure to different environments, or compare how quickly breathing rate returns to normal after activity. In every case, the design matters as much as the result.
A scientific investigation begins with a question that can be answered with evidence. For example, "Does moderate exercise increase heart rate?" is testable because heart rate can be measured. "Is exercise good?" is too broad and vague. A well-designed question points toward specific observations and measurements.
Strong investigations are built to separate real patterns from noise. Biological systems vary naturally from person to person and from moment to moment. If one student measures pulse after running once, that result may reflect stress, caffeine, poor counting, or random variation rather than exercise alone. To make a reliable claim, the investigator must design a procedure that reduces uncertainty and allows patterns to appear clearly.
Variables are factors that can change in an investigation. A fair test changes one main factor at a time while keeping other important conditions as constant as possible.
This is especially important when studying body systems controlled by feedback. A feedback mechanism is a process in which a biological system responds to a change and influences that change. Most homeostatic systems use negative feedback, meaning the response reduces the original disturbance. If body temperature rises, sweating helps cool the body. If glucose falls, hormones act to raise it. To investigate these systems scientifically, the data must be planned carefully enough to capture change over time.
A complete investigation has several connected parts: a question, a hypothesis, identified variables, a procedure, repeated measurements, and a plan for analyzing the data. Each part influences the others. If one part is unclear, the entire investigation becomes weaker.
[Figure 1] The question states what you want to find out. The hypothesis is a testable prediction based on scientific reasoning. For example: "If exercise intensity increases, then average heart rate will increase because muscles require more oxygen, causing the cardiovascular system to respond." This prediction connects biological knowledge to measurable outcomes.
The independent variable is the factor intentionally changed. The dependent variable is the factor measured in response. In an exercise investigation, exercise intensity could be the independent variable and heart rate the dependent variable. Controlled variables, sometimes called constants, are conditions kept the same, such as room temperature, measurement method, exercise duration, and rest time before testing.
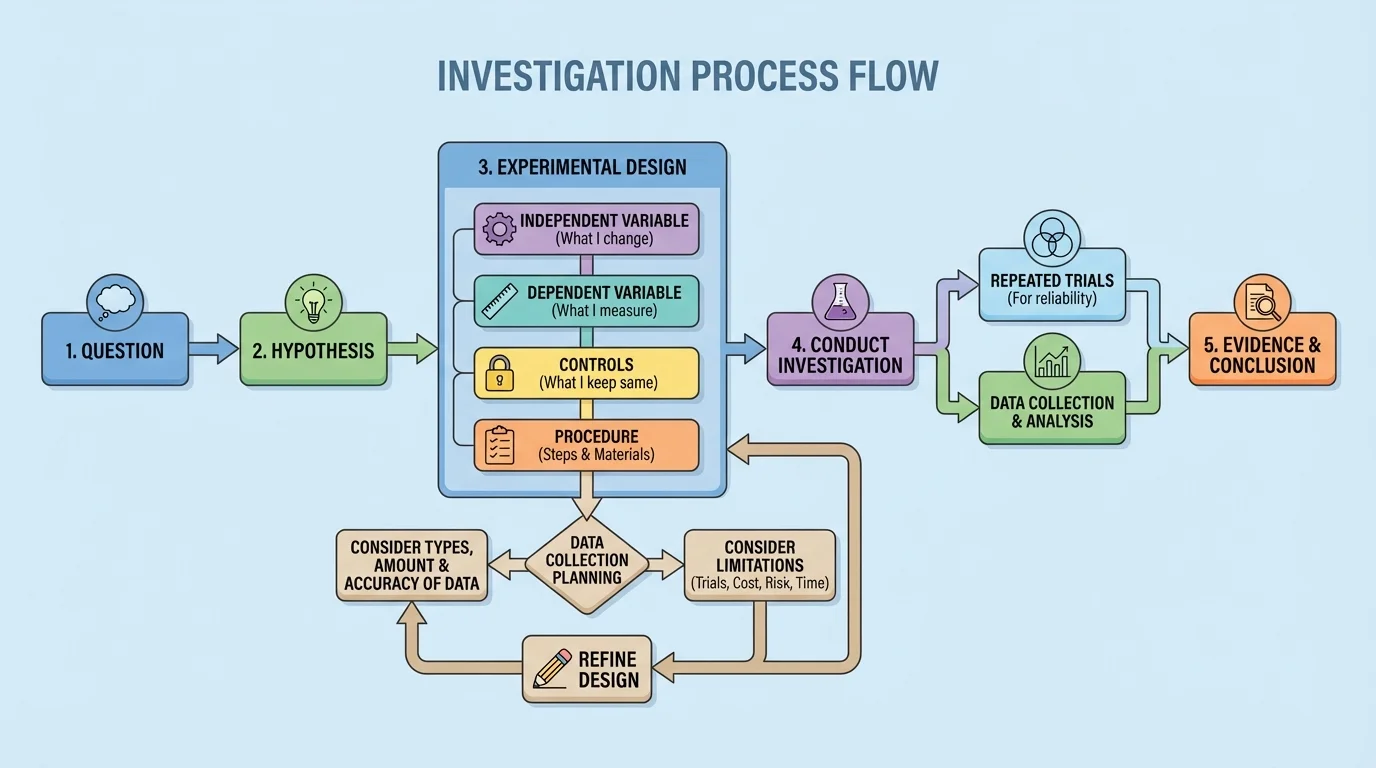
Another critical part is the control condition or comparison condition. In some investigations, this is a true control group. In others, it is a baseline measurement taken before any change occurs. For example, resting pulse before exercise provides a comparison for pulse after exercise. Without that baseline, it is difficult to know whether the measured values represent change or just normal variation.
Repeated trials are also essential. A single measurement can be misleading. If pulse counts from three trials are approximately the same, confidence increases that the trend is real. If they vary widely, the procedure may need improvement. Scientists often calculate an average to represent repeated data. For example, if recovery times are measured as \(90 \textrm{ s}\), \(96 \textrm{ s}\), and \(99 \textrm{ s}\), the mean is \((90 + 96 + 99) \div 3 = 95 \textrm{ s}\).
Not all data are the same. Good investigators choose data types that match the question. Quantitative data are numerical measurements such as pulse rate, body temperature, time, mass, or breathing rate. Qualitative data are descriptive observations such as skin flushing, sweating, leaf wilting, or alertness. Many biological investigations use both.
If the question asks about change in body function, quantitative data are often central because numbers can be compared directly. For instance, pulse rate can be measured in beats per minute, body temperature in degrees, and breathing rate in breaths per minute. But qualitative observations can still matter. During an exercise investigation, a student may note visible sweating or shortness of breath as additional evidence that the body is responding to stress.
Investigators must also decide how much data is enough. More data usually improve reliability, but only up to a point. If you measure heart rate once before exercise and once after, the evidence is weak. If you measure before exercise, immediately after, and at several recovery times for multiple trials, the data become much more useful. The right amount depends on the question. A time-based question often needs multiple time points. A comparison question often needs multiple trials for each condition.
Sample size matters too. Measuring one person's response cannot support a broad conclusion about humans. Measuring several individuals gives a better picture of biological variation. However, larger sample sizes require more time and coordination. Scientists balance the value of more data against practical limits.
| Question Type | Useful Data | Why It Fits |
|---|---|---|
| How does exercise affect heart rate? | Pulse before, after, and during recovery | Shows change over time |
| How does temperature affect enzyme action? | Reaction time, product amount, temperature | Measures rate under different conditions |
| How do plants respond to dry air? | Leaf appearance, mass change, stomatal observations | Combines numerical and descriptive evidence |
Table 1. Examples of matching scientific questions with appropriate data.
Elite athletes and doctors both depend on careful biological data, but for different reasons. Coaches may track recovery time to improve performance, while physicians may track it to detect cardiovascular problems.
Choosing the right data also means deciding the scale of measurement. A stopwatch reading to the nearest second may be enough for recovery time, but not for a very fast chemical reaction. A thermometer marked every \(1^{\circ}\textrm{C}\) may be too coarse if tiny temperature differences matter. The required precision depends on the biological effect being studied.
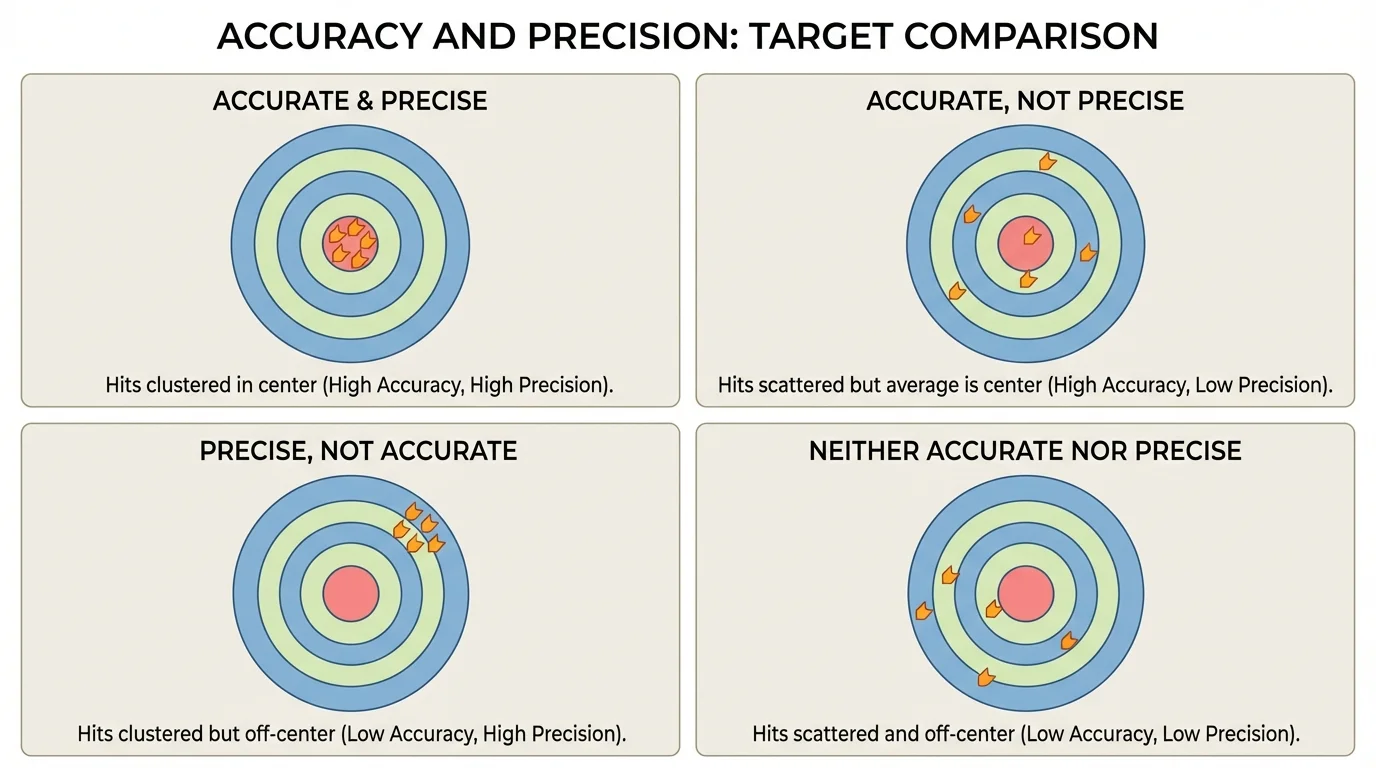
Students often confuse accuracy, precision, and reliability, but they are not the same. Accuracy is how close a measurement is to the true value. Precision is how close repeated measurements are to one another. Reliability refers to the consistency and trustworthiness of data across trials or repeated investigations.
[Figure 2] Suppose a digital thermometer reads body temperature as \(37.0^{\circ}\textrm{C}\), \(37.1^{\circ}\textrm{C}\), and \(37.0^{\circ}\textrm{C}\). These values are precise because they are close together. If the true temperature is about \(37.0^{\circ}\textrm{C}\), they are also accurate. But if the thermometer is poorly calibrated and the true temperature is \(36.5^{\circ}\textrm{C}\), the measurements may be precise but inaccurate.
In biology, precision can be limited by both instruments and living systems. Pulse rate changes from second to second. Counting beats for \(15 \textrm{ s}\) and multiplying by \(4\) is faster, but it is usually less precise than counting for \(60 \textrm{ s}\). On the other hand, counting for a full minute may be difficult immediately after intense exercise. The investigator must weigh convenience against measurement quality.
One way to improve reliability is to repeat measurements and use averages. If three pulse counts after the same exercise trial are \(120\), \(124\), and \(122\) beats per minute, the mean is \((120 + 124 + 122) \div 3 = 122\). The small spread suggests good precision. If the values were \(110\), \(126\), and \(138\), the average would still be calculable, but the large variation would suggest lower reliability or poor control of the procedure.
Measurement uncertainty and biological variation
No investigation produces perfect data. Some uncertainty comes from tools, such as stopwatch reaction time or thermometer resolution. Some comes from the organism itself, because living systems naturally fluctuate. Good design does not eliminate all uncertainty; it reduces avoidable uncertainty and reports the limits honestly.
Scientists also consider the precision of measuring devices. A balance reading to the nearest \(0.01 \textrm{ g}\) provides more detail than one reading to the nearest \(1 \textrm{ g}\), but the more precise tool may cost more or require more careful use. Better precision is valuable only if it meaningfully improves the investigation.
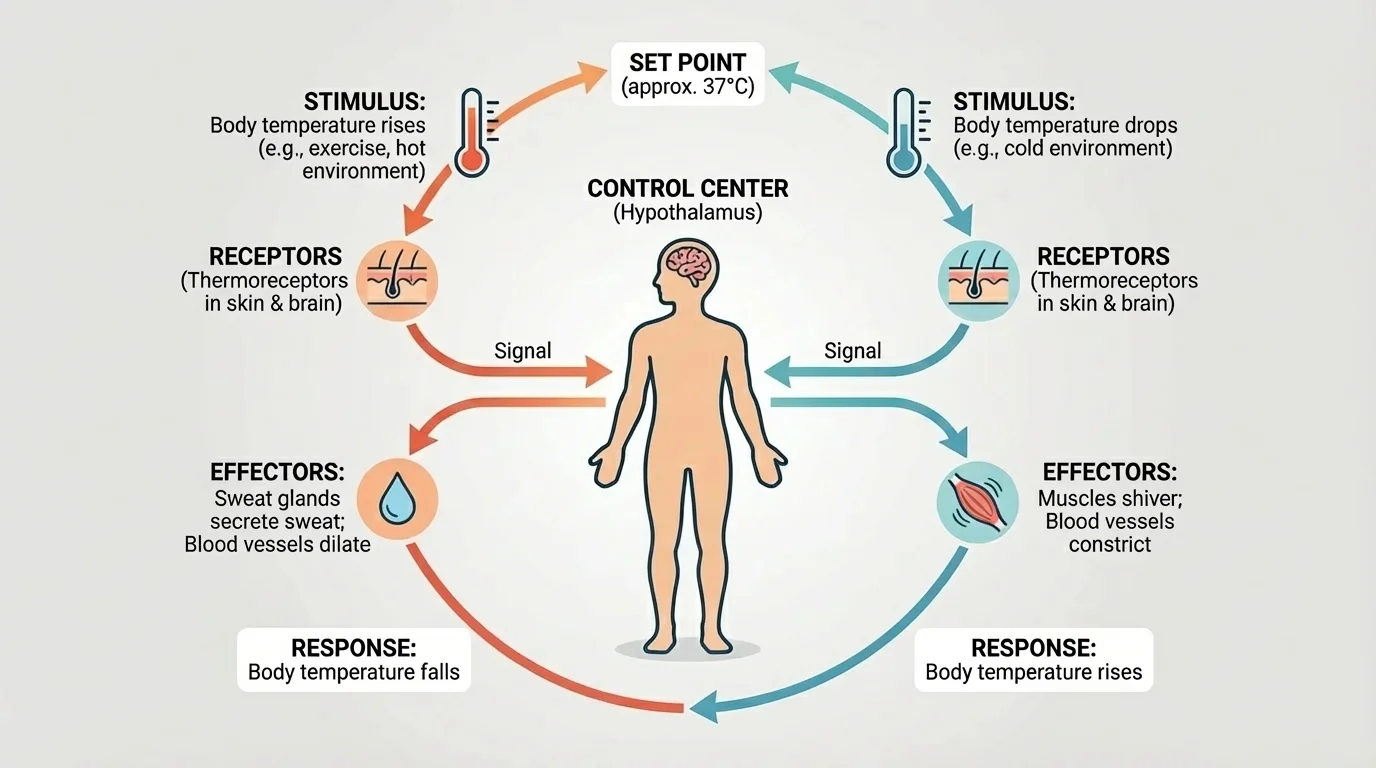
Homeostasis depends on systems that detect change, process information, and trigger responses. In a negative feedback loop, a condition moves away from a set range, receptors detect the change, a control center processes the information, and effectors act to bring the condition back toward normal.
[Figure 3] Body temperature is a clear example. If temperature rises, receptors and the nervous system signal responses such as sweating and increased blood flow near the skin. If temperature falls, shivering and reduced blood flow near the skin help conserve or generate heat. An investigation about body temperature regulation might compare skin temperature or cooling rate before and after exercise, but it should be designed safely and ethically.
Another common homeostasis investigation focuses on heart rate recovery. Exercise disturbs internal balance by increasing demand for oxygen and energy. The body responds through the cardiovascular and respiratory systems. Measuring heart rate before exercise, immediately after, and during recovery can provide evidence that feedback mechanisms help return the body toward resting conditions.
Other possible investigations include measuring breathing rate after stair climbing, observing stomatal opening in plant leaves under different humidity conditions, or exploring how yeast activity changes with temperature as a model for enzyme-related biological processes. In each case, the investigation should connect measurable changes to regulation within living systems.
When planning a homeostasis investigation, students should ask: What indicates the system has been disturbed? What response can be measured safely? Over what time scale does the system respond? These questions help determine the type and timing of data needed.
Real scientific work is shaped by limits. A perfect design on paper may not be possible in practice. Time may be short. Equipment may be shared. Some tools may be expensive. Some procedures may involve risk. A strong investigator recognizes these limits and refines the design instead of ignoring them.
Suppose students want to study how exercise intensity affects recovery time using \(20\) participants, five intensity levels, and three trials each. That would produce a large amount of data, but it may be unrealistic in one class period. A revised design might use \(8\) participants, three intensity levels, and two trials each. The data set is smaller, but still useful if the procedure is consistent and the limits are stated clearly.
Refining an investigation because of constraints
Question: How does exercise duration affect pulse recovery time?
Step 1: Original design
Students plan durations of \(30\), \(60\), \(90\), and \(120 \textrm{ s}\), with \(5\) trials per person for \(10\) people. This gives \(4 \times 5 \times 10 = 200\) exercise trials.
Step 2: Identify limitations
The class has only one lesson period, recovery between trials takes several minutes, and intense exercise may create fatigue that affects later trials.
Step 3: Refine the design
Students reduce the durations to \(30\), \(60\), and \(90 \textrm{ s}\), lower the number of trials to \(3\) per person, and assign participants to separate duration groups. The revised total is \(3 \times 3 \times 10 = 90\) trials.
Step 4: Protect data quality
They keep the measurement method, rest period, and exercise type constant, so the reduced design still produces meaningful comparisons.
Safety and ethics matter especially in biological investigations involving humans. Students should avoid harmful procedures, respect privacy, and use low-risk activities suitable for the class. For example, measuring pulse after light or moderate exercise is generally more appropriate than pushing participants to exhaustion. A refined design is not a weaker design if it is safer and more realistic.
Cost also affects precision. A laboratory sensor may measure pulse continuously, but manual pulse counting costs nothing. If manual counting is used, the procedure should be improved in other ways, such as training observers, counting for equal times, and using repeated trials. That is how scientists adapt to limitations without abandoning rigor.
Investigations can be carried out individually or collaboratively, and each approach has strengths. Individual work helps students practice planning, observing, and interpreting data on their own. Collaborative work allows larger data sets, shared roles, and cross-checking of methods.
In a group investigation, one student might time exercise, another count pulse, another record data, and another monitor rest intervals. This division of labor can improve efficiency, but only if everyone follows the same protocol. If one group counts pulse for \(15 \textrm{ s}\) and another for \(30 \textrm{ s}\), the data may not be directly comparable.
Collaboration also helps expose mistakes. If one team obtains very different results, the class can compare procedures and look for hidden variables. As illustrated earlier in [Figure 2], repeated and consistent methods are what turn scattered observations into reliable evidence.
"The most exciting phrase to hear in science, the one that heralds new discoveries, is not 'Eureka!' but 'That's funny ...'"
— Isaac Asimov
That quote matters because unusual results are not automatically wrong. They may reveal an error in procedure, but they may also reveal an overlooked biological factor. Good collaboration helps distinguish between those possibilities.
Patterns are often easier to detect when data are organized clearly. Raw numbers written in a notebook may not reveal much, but a table or graph can show trends, outliers, and rates of change.
[Figure 4] For an exercise investigation, a data table might include resting pulse, immediate post-exercise pulse, pulse after \(1\) minute, pulse after \(2\) minutes, and pulse after \(3\) minutes. From this, students can graph pulse against time. If the graph drops toward the resting value, that supports the idea that the body is restoring internal balance.
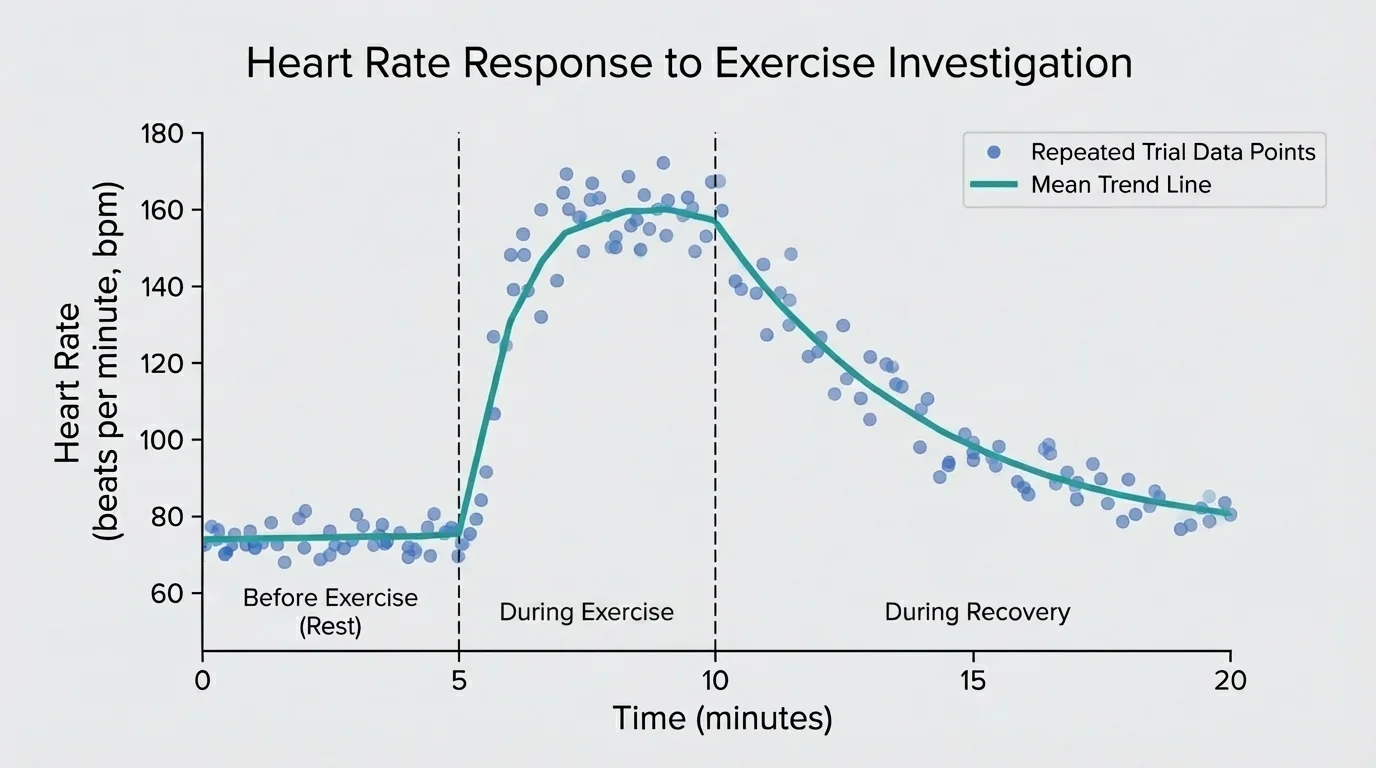
Students should look for both central tendency and spread. The average shows the typical result, while the range shows variability. If resting pulse values in three trials are \(72\), \(74\), and \(70\), the range is \(74 - 70 = 4\). A small range suggests consistent measurements. A very large range may suggest poor control or a naturally unstable condition.
Outliers deserve attention. An outlier is a data point very different from the others. If one recovery time is much longer than the rest, students should ask whether the participant misunderstood the instructions, whether counting was inaccurate, or whether a real biological reason explains the difference. Outliers should not be removed casually. They should be examined thoughtfully.
| Trial | Resting Pulse | Pulse Immediately After | Pulse After \(2\) min |
|---|---|---|---|
| \(1\) | \(72\) | \(132\) | \(92\) |
| \(2\) | \(74\) | \(128\) | \(90\) |
| \(3\) | \(70\) | \(130\) | \(91\) |
Table 2. Sample pulse data from repeated exercise trials.
Using these data, the mean pulse immediately after exercise is \((132 + 128 + 130) \div 3 = 130\). The mean pulse after \(2\) minutes is \((92 + 90 + 91) \div 3 = 91\). Because the average decreases over time, the data support the claim that the body is recovering toward resting conditions. The graph in [Figure 4] makes that trend visible much faster than a list of numbers alone.
Evidence is more than data
Data are the measurements and observations collected during an investigation. Evidence is what those data become after they are analyzed and connected logically to a scientific claim. A conclusion should always be based on evidence, not just on what the investigator expected to happen.
When writing claims, students should avoid overstating the results. If the investigation tested a small group under one set of conditions, the claim should stay within that scope. For example, "In this investigation, moderate exercise increased average pulse rate and pulse then decreased during recovery" is stronger than "Exercise always improves homeostasis in all humans."
One common mistake is changing too many variables at once. If students compare walking indoors for \(1\) minute with running outdoors for \(3\) minutes, both exercise intensity and environment have changed. That makes it hard to identify the cause of any difference.
Another mistake is using too few trials. With only one trial, random error has too much influence. A third mistake is inconsistent measurement. For example, one observer may count pulse at the wrist while another counts at the neck, or one may start timing late. Standardized methods reduce these problems.
Sampling bias is another concern. If all participants are from one sports team, the results may not represent the wider student population. Biological variation must be considered when interpreting results. The feedback loop shown in [Figure 3] operates in all healthy humans, but the speed and size of the response can differ across individuals.
Human body temperature does not stay at exactly one number all day. It normally changes slightly with time of day, activity level, and environment, which is one reason repeated measurements matter in homeostasis investigations.
A final mistake is treating technology as automatically accurate. Digital sensors are useful, but they still require calibration, correct placement, and correct interpretation. Good science depends on method, not just on devices.
Consider an investigation asking whether increasing exercise duration changes how quickly pulse returns to resting level. This is a strong biology question because it examines how the body responds to a disturbance and then uses feedback processes to recover.
The independent variable is exercise duration, such as \(30\), \(60\), and \(90 \textrm{ s}\). The dependent variable is recovery time, defined as the time required for pulse to return within a chosen range of the resting pulse. Controlled variables include exercise type, rest before each trial, room conditions, pulse-counting method, and the person performing the counting.
Case study design
Step 1: Establish baseline data
Measure resting pulse three times for each participant and calculate the mean. If the three readings are \(68\), \(72\), and \(70\), the baseline mean is \((68 + 72 + 70) \div 3 = 70\).
Step 2: Apply one condition
Have the participant perform the first exercise duration, then measure pulse immediately and every \(30 \textrm{ s}\) until it returns close to the baseline mean.
Step 3: Repeat trials
Run at least \(3\) trials for each duration, allowing enough rest between trials so earlier exercise does not affect the next condition.
Step 4: Compare means
If mean recovery times are \(60\), \(95\), and \(140 \textrm{ s}\) for the three durations, the pattern suggests longer exercise requires longer recovery.
This design may still need refinement. If the full procedure takes too long, students might reduce the number of durations or use fewer participants while keeping repeated trials. If manual pulse counting proves inconsistent, they might lengthen the counting interval or train observers more carefully. Refinement is a sign of strong scientific thinking, not failure.
The most important test of a design is whether it produces evidence that answers the original question. A neat table of numbers is not enough unless the numbers are appropriate, sufficiently repeated, accurately measured, and clearly connected to the biological concept being studied.
Planning and conducting an investigation means making reasoned decisions before, during, and after data collection. It requires deciding what to measure, how to measure it, how often to measure it, and what limitations may affect the result. In biology, especially when studying homeostasis, those decisions determine whether the investigation captures a genuine feedback response or only random noise.
Scientists do not simply collect as much data as possible. They collect the right data, in the right way, with a design that is realistic and safe. They recognize limits in precision, acknowledge uncertainty, and refine procedures to improve reliability. Whether the investigation is done individually or collaboratively, the goal is the same: produce data that can serve as the basis for evidence.