A medicine is called "effective," a phone case is advertised as "drop-proof," and a graph online seems to show that one trend is rapidly increasing. But what if the conclusion sounds stronger than the evidence? In science and engineering, progress often begins not with accepting a statement, but with asking the right question. Strong thinkers do not reject ideas automatically; they test them. They ask whether the starting assumptions are sound, whether the data are being interpreted fairly, and whether a design actually fits the problem it claims to solve.
This skill is central to both scientific thinking and engineering design thinking. In science, questions help us investigate the natural world: Is the explanation supported by evidence? Was the test fair? Are there other causes? In engineering, questions help us define problems and improve solutions: Who is this design for? What constraints matter most? What happens under real conditions, not ideal ones? Asking challenge questions is not negativity. It is a disciplined way of improving understanding and avoiding mistakes.
Argument means a claim supported by reasons and evidence. A premise is a starting idea or assumption used to support a conclusion. A conclusion is the claim that the argument is trying to establish. In science, a data set is a collection of observations or measurements. In engineering, design suitability refers to how well a design meets the needs, criteria, and constraints of a problem.
At a high level, this topic is about moving from "Is this interesting?" to "How do we know this is true, trustworthy, or useful?" That shift matters in lab reports, technical drawings, policy debates, environmental studies, and even product reviews. A good challenge question can reveal missing evidence, hidden bias, careless measurement, or a design that works in theory but fails in practice.
Scientists and engineers rarely treat first answers as final answers. A result may look convincing until someone asks about sample size. A design may seem efficient until someone asks who cannot use it. A graph may seem dramatic until someone notices that the vertical axis starts at \(95\) instead of \(0\). Critical questioning protects us from false confidence.
This is especially important when decisions affect health, safety, cost, or the environment. Suppose a city wants to reduce flooding. One team argues that deeper drains are the solution. Another asks whether the premise is too narrow: Is the real issue rainfall intensity, blocked storm drains, paved surfaces that prevent absorption, or building in flood-prone areas? The quality of the final decision depends on the quality of the questions asked at the beginning.
Some major scientific advances began because someone doubted an accepted assumption. The discovery that ulcers can be caused by bacteria challenged the earlier premise that stress alone was responsible.
Questioning also improves communication. If you can explain why a claim is weak, which assumption is unsupported, or which design criterion is missing, you are not just disagreeing. You are reasoning.
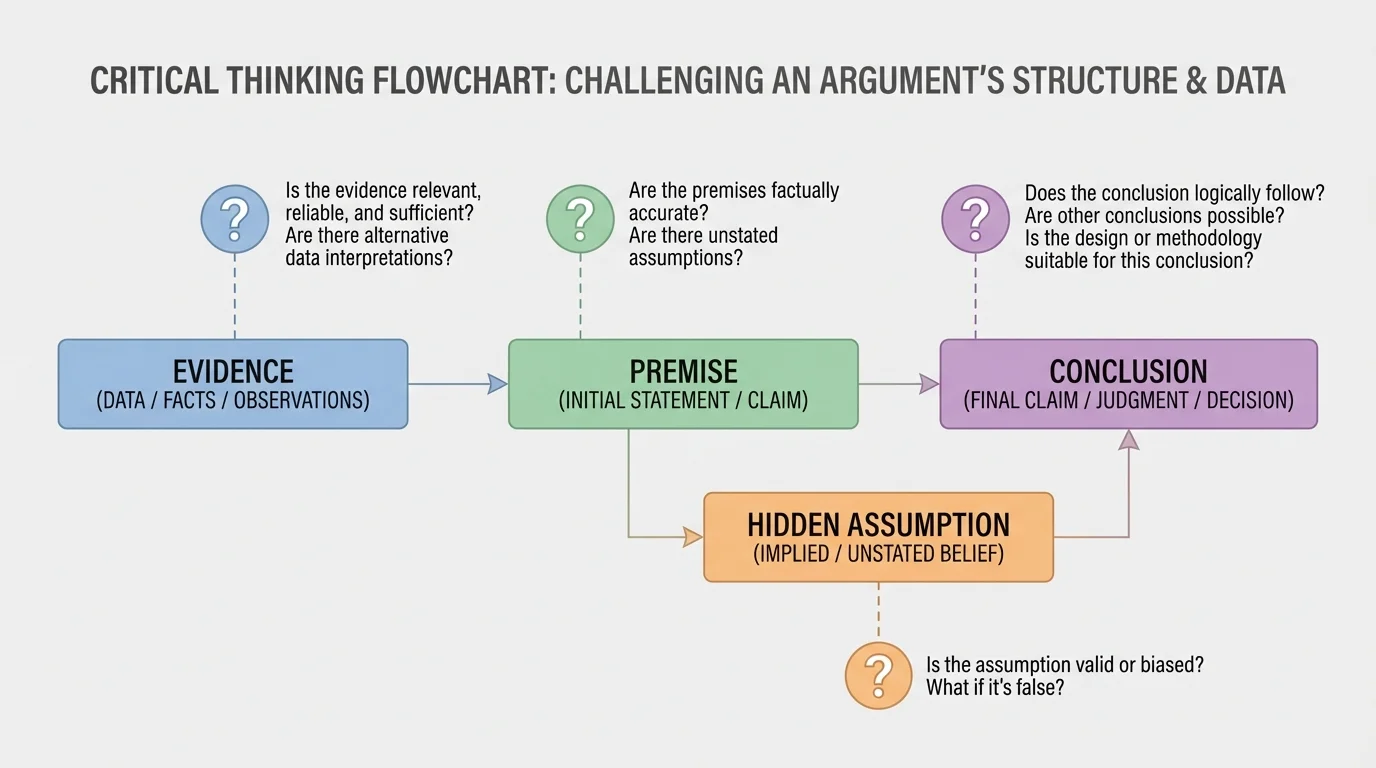
An argument often looks simple on the surface: evidence is presented, and a conclusion follows. But between the evidence and the conclusion lie assumptions. The first step in analysis is to identify what the speaker or writer is taking for granted. Some assumptions are stated clearly. Others are hidden.
For example, consider the claim: "Students who listen to music while studying get better grades, so music improves learning." One premise might be that the students who chose to listen to music are otherwise similar to those who did not. Another hidden assumption might be that music itself caused the difference, rather than study time, prior knowledge, or motivation. If these premises are weak, the conclusion is weaker than it appears.
Hidden assumptions often make arguments seem stronger than they are. A hidden assumption is an idea that must be true for the conclusion to make sense, even if it was never stated directly. Challenging hidden assumptions is one of the most powerful ways to evaluate a claim.
A premise can fail in several ways. It may be false, incomplete, too broad, too narrow, irrelevant, or based on bias. If someone says, "Electric cars are always better for the environment," you should ask: better in what way? During use? Over the entire manufacturing life cycle? In all countries, even where electricity is generated mainly from fossil fuels? The argument may depend on a premise that ignores important conditions.
Arguments can be examined layer by layer, as [Figure 1] shows, by tracing how evidence leads to premises, how premises rely on assumptions, and how those assumptions support a conclusion. When you challenge a premise, you are not just saying "I disagree." You are asking whether the starting point deserves confidence.
Useful challenge questions include: What assumption is being made here? Is that assumption supported by evidence? Does the conclusion still hold if the assumption changes? Are there alternative premises that would lead to a different conclusion? Is the premise based on a limited group, special case, or outdated idea?
Take this claim: "School start times should be moved later because tired students perform worse." This argument may be strong, but it still deserves analysis. Is the premise that lack of sleep is caused mainly by early start times? Could homework load, screen use at night, jobs, or stress also matter? Is "perform worse" measured by test scores, attendance, mood, or long-term learning? A challenge question does not necessarily defeat the argument; it can also help refine it.
Another example comes from environmental debate: "This town had a colder winter, so global warming is not real." The premise here is that local short-term weather can disprove long-term global climate trends. That premise is weak because weather and climate are not the same scale of evidence. A single cold season in one place does not override long-term average temperature patterns across the globe.
Case study: evaluating a sports claim
A coach says, "Our new training drill caused the team's improvement because players ran faster this month."
Step 1: Identify the conclusion
The conclusion is that the new drill caused the improvement.
Step 2: Identify likely premises
The coach assumes the drill was the main change and that the measured faster times reflect real improvement rather than random variation.
Step 3: Challenge the premises
Were players also sleeping more, practicing more often, or competing against different opponents? Was the timing method the same each time? Were weather conditions similar?
Step 4: Refine the argument
A stronger claim would compare similar groups, use consistent measurement, and rule out major alternative causes.
Strong challenge questions often improve the original claim instead of destroying it. That is one reason scientists revise hypotheses and engineers revise design briefs. Better questions produce better versions of ideas.
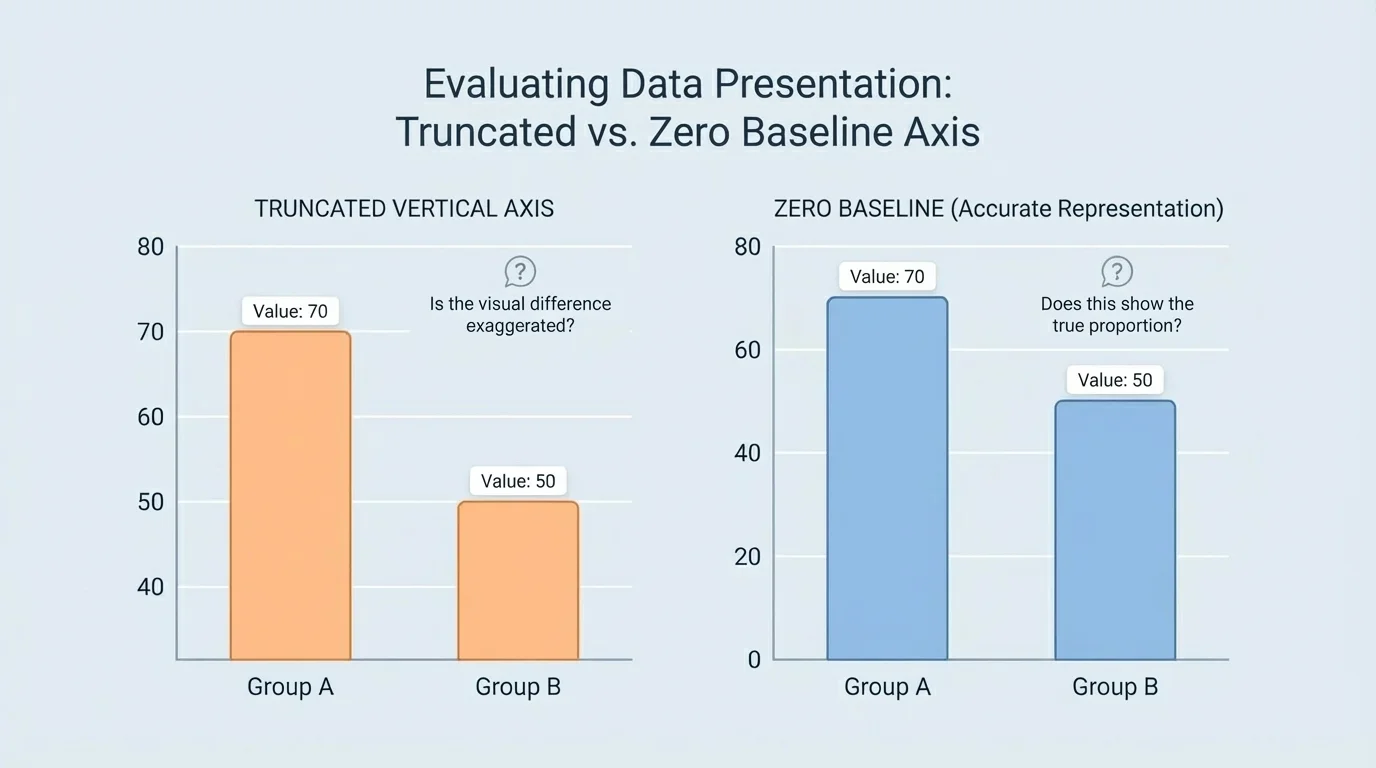
[Figure 2] Data do not speak for themselves. People interpret them, and interpretation can be careful or careless. A correlation may be mistaken for cause. A small sample may be treated as if it represents everyone. An average may hide important variation. Even the visual design of a graph can change the impression a viewer receives.
One of the most important questions is whether the conclusion matches what the data actually show. If ice cream sales and drowning incidents both rise in summer, the data may show correlation, but that does not mean ice cream causes drowning. A third factor, warmer weather, helps explain both. This is why the question "What other variable could explain this pattern?" is so powerful.
Another key issue is sample size. If a company surveys \(12\) students and announces that "\(83\%\) prefer our app," the percentage sounds impressive, but the sample is tiny. Since \(83\%\) of \(12\) is about \(10\) students, the result may not represent a school, city, or country. A larger and more representative sample usually gives more trustworthy information.
Graph design matters too. If two bar heights are \(100\) and \(105\), the difference is only \(5\), but a graph with a vertical axis from \(95\) to \(106\) can make the change look huge. A graph with a vertical axis from \(0\) to \(120\) makes the same difference look modest. The graph has not changed the numbers, but it has changed the visual impact.
Context also matters. Suppose a report says a disease rate doubled. That sounds alarming, but doubled from what? If the rate went from \(1\) case per \(10{,}000\) people to \(2\) cases per \(10{,}000\), the relative increase is large, but the absolute risk is still low. Good interpretation requires both relative and absolute thinking.
Measures of center can mislead when used alone. The mean score of a class may be \(75\), but that does not reveal whether most students scored near \(75\) or whether half scored near \(95\) and half near \(55\). Spread matters. If a data set has high variability or extreme outliers, the average may not reflect a "typical" value well.
From earlier work with statistics, remember that a graph is a representation, not the data itself. Scales, labels, intervals, and categories all influence what patterns are easy or hard to notice.
When evaluating a data interpretation, ask questions such as: How were the data collected? Is the sample representative? Are important categories missing? What does the graph scale do to the visual message? Are there outliers? Is someone claiming causation when the data only support correlation? The same caution that you use in science class also applies to social media posts, advertisements, and news stories.
| Question | Why it matters | Example concern |
|---|---|---|
| Who was included in the sample? | It affects whether the data represent the broader population. | A survey of only athletes may not represent all students. |
| How large was the sample? | Small samples can produce unstable results. | \(8\) responses cannot support a strong general claim. |
| What variables were measured? | Missing variables can distort interpretation. | Sleep study ignores caffeine use. |
| How is the graph scaled? | Scale can exaggerate or minimize differences. | Axis begins at \(95\) instead of \(0\). |
| Does the claim imply causation? | Correlation alone does not prove cause. | More study apps downloaded does not prove apps cause higher grades. |
Table 1. Questions that help test whether a data interpretation is trustworthy.
Later, when you compare multiple interpretations of the same evidence, [Figure 2] remains a useful reminder that numbers can stay constant while impressions change dramatically.
In science, a conclusion is only as strong as the investigation behind it. A fair test changes one main factor at a time while keeping other relevant conditions as constant as possible, as [Figure 3] shows in a simple controlled setup. This allows scientists to connect a result to a likely cause more confidently.
To evaluate experimental design, identify the independent variable, the factor intentionally changed, and the dependent variable, the factor measured in response. Then ask whether other variables were controlled. If they were not, the result may be ambiguous.
Suppose students test whether fertilizer affects plant growth. If one plant gets more sunlight, a larger pot, or more water than the others, the design is weak. The question is not just "Did one plant grow taller?" but "Can we reasonably connect the height difference to fertilizer rather than another factor?"
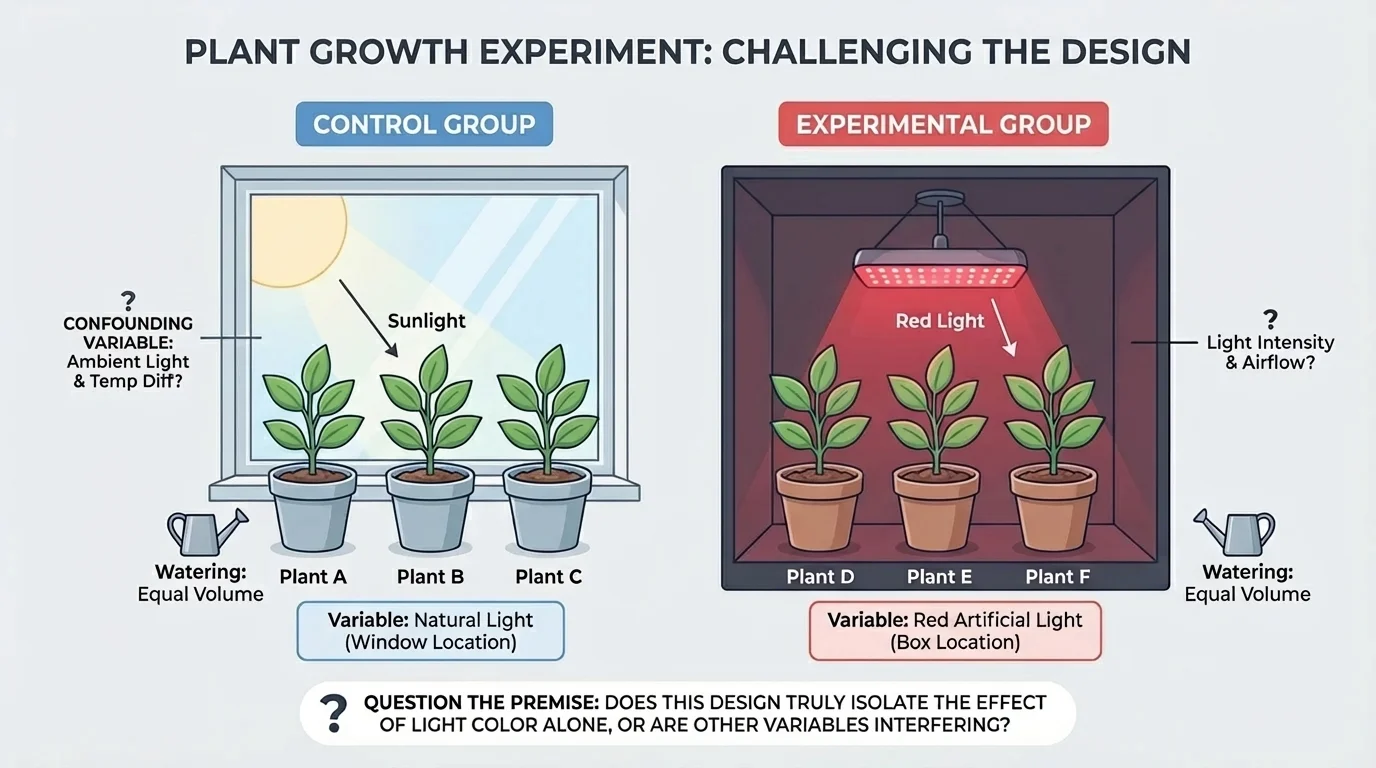
A strong experiment often includes a control group. This group does not receive the treatment being tested, so it provides a comparison. Without a control, it becomes much harder to tell whether a treatment caused the effect or whether the effect would have happened anyway.
Measurement quality also matters. Were tools calibrated? Were observations repeated? Was the procedure clear enough for someone else to repeat it? Repeatability is essential because science depends on results that others can test. If a result appears only once and cannot be reproduced, confidence in the conclusion remains limited.
Reliability and validity are related but not identical. Reliability means a method gives consistent results when repeated under similar conditions. Validity means the method actually measures what it is supposed to measure. A stopwatch may reliably record time, but if students start and stop it inconsistently, the test may still lack validity for comparing runners.
Questioning design also involves ethics and scope. In medical research, for example, investigators must ask whether the study protects participants and whether the test population matches the people who will eventually use the treatment. A treatment tested only on one age group may not be suitable for all patients.
Case study: testing a claim about phone use and sleep
A report says students who use phones at night sleep less, so phone use reduces sleep.
Step 1: Examine the design
Was this an experiment or only an observational study? If students were simply surveyed, the result may show association rather than cause.
Step 2: Check control of variables
Were caffeine use, homework time, stress, room lighting, and bedtime habits considered?
Step 3: Ask about measurement
Was sleep measured by self-report or by a device that tracks sleep duration more directly?
Step 4: Evaluate the conclusion
A careful conclusion might be: nighttime phone use is associated with reduced sleep in this sample, but stronger causal claims require better controlled experiments.
The same careful thinking applies to chemistry, physics, biology, and environmental science. If a reaction rate changes, ask whether temperature, concentration, and surface area were all managed. If water quality differs at two sites, ask whether the sampling times and methods were comparable.
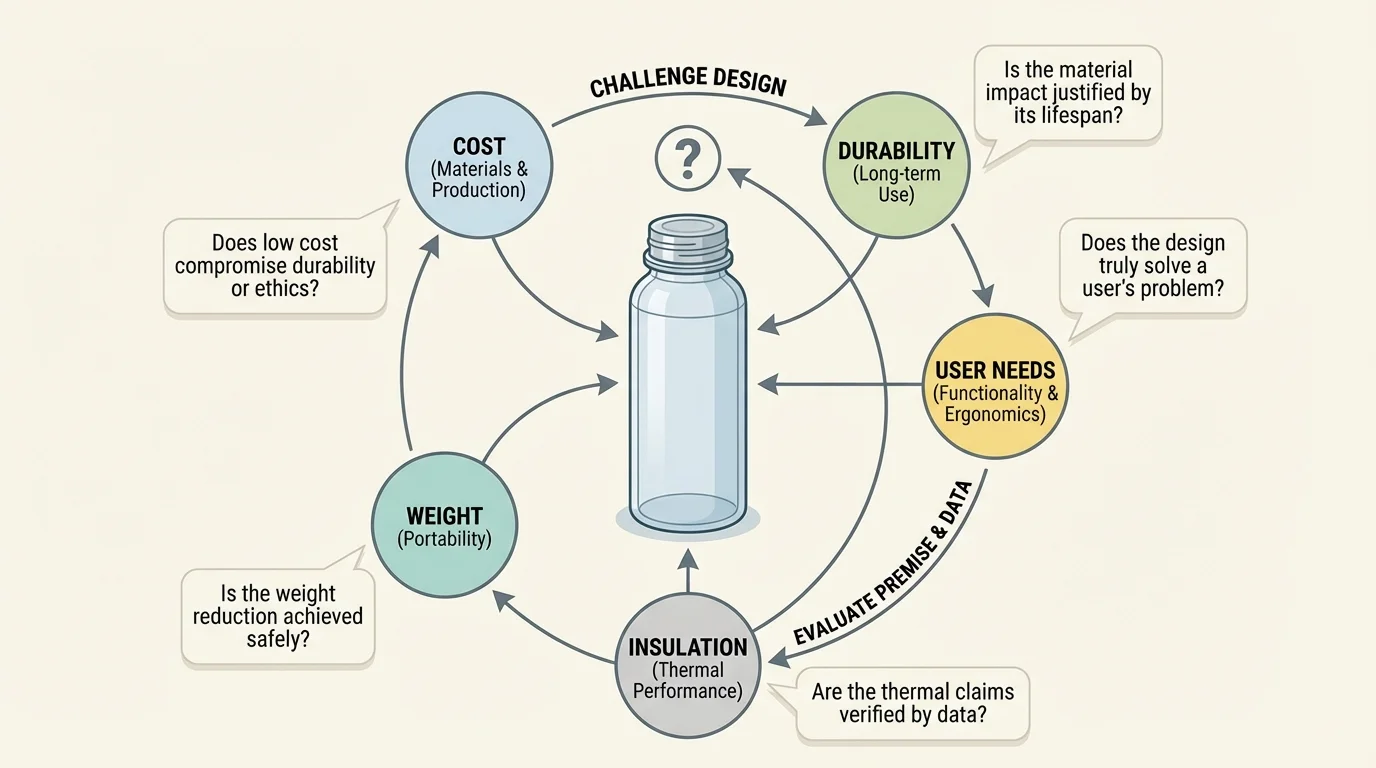
Engineering begins with a problem that must be clearly defined. A design is not judged only by whether it "works" once. It is judged by whether it is suitable for real users, conditions, criteria, and constraints, as [Figure 4] emphasizes. A bridge, a medical device, a filter, or an app may function in some basic sense and still be a poor solution.
To test design suitability, engineers ask: What is the design supposed to do? For whom? Under what conditions? What counts as success? What limits exist on materials, cost, time, safety, energy use, size, or environmental impact? These are called criteria and constraints.
Consider a reusable water bottle. One design is extremely durable but heavy. Another is light but cracks easily. Another keeps drinks cold for \(12\) hours but is too expensive for the target market. Which is best? There is no single answer outside the problem definition. A hiking bottle, a school bottle, and an emergency relief bottle may require different trade-offs.
This is why challenge questions in engineering often focus on fit: Does the design solve the right problem? Does it work under realistic conditions? Does it create new problems? Is it safe? Is it accessible? Is maintenance practical? Can it be produced at scale? A design that performs well in a lab but fails in heat, cold, stress, repeated use, or low-cost manufacturing may not be suitable.
Engineering also involves trade-offs. Improving one feature may weaken another. A lighter bicycle frame may be less sturdy. A stronger encryption system may slow a device. A water filter that removes more contaminants may also reduce flow rate. Good evaluation asks not "Is it perfect?" but "Which compromises are acceptable for this purpose?"
Case study: evaluating a school backpack design
A company markets a backpack as the best design for students.
Step 1: Identify the problem definition
The backpack should carry school materials safely and comfortably for a range of users.
Step 2: List criteria
Comfort, durability, storage, weight distribution, water resistance, and affordability.
Step 3: List constraints
Material cost, size limits, school locker dimensions, and manufacturing time.
Step 4: Ask challenge questions
Does it fit smaller and larger students? Do straps adjust well? Does the material tear after repeated use? Is it too expensive for the intended market?
Step 5: Judge suitability
A backpack may be excellent for travel but less suitable for daily school use if it is too heavy or costly.
When students define engineering problems clearly, they avoid a common mistake: solving the wrong problem very efficiently. That is why engineers repeatedly test prototypes, gather user feedback, and redesign.
Some patterns appear again and again when arguments, data interpretations, or designs are weak. One is cherry-picking, selecting only the evidence that supports a conclusion while ignoring evidence that does not. Another is confirmation bias, the tendency to notice and value information that matches what one already believes.
A second red flag is overgeneralization. If a treatment works in one small group, it does not automatically work for everyone. If a material survives one stress test, it is not automatically suitable for every environment. A single case may suggest a possibility, but it rarely justifies a broad conclusion.
A third problem is confusing precision with certainty. A report may present values such as \(72.43\%\), giving an impression of exactness. But if the underlying measurements are noisy or the sample is small, the extra decimal places do not make the conclusion more trustworthy.
There is also the danger of ignoring scale and context. A battery improvement of \(2\%\) might be significant for satellites but minor for a household device. A design that is excellent in a city with reliable electricity may be unsuitable in remote regions where replacement parts and charging are difficult to obtain.
"The important thing is not to stop questioning."
— Albert Einstein
That quote captures a habit, but in science and engineering questioning must be disciplined. Questions should connect to evidence, method, logic, and purpose.
Public health offers strong examples. Suppose a new vaccine is reported to reduce infection in a trial. Challenge questions include: How large was the trial? Was there a control group? How long were participants followed? Did the study include different age groups? Was effectiveness measured against infection, severe illness, or both? These questions do not reject the vaccine; they clarify what the evidence actually supports.
Environmental engineering provides another case. A town installs reflective roofing to reduce urban heat. If temperatures drop in one neighborhood, is the design responsible, or were there also changes in tree cover, traffic, or weather patterns? Is the roof material affordable, durable, and effective across seasons? As we saw earlier with criteria and constraints in [Figure 4], suitability depends on more than one attractive result.
Consumer technology gives everyday examples. A phone manufacturer says a new screen is "\(2\) times stronger." Stronger in what test? Drop height? Scratch resistance? Pressure? Angle of impact? If the company highlights only one stress condition, the claim may be narrower than consumers assume.
In climate science, data from ice cores, ocean temperatures, atmospheric \(\textrm{CO}_2\), and long-term temperature records must be interpreted together. A person who points to one cold day as evidence against global warming is not evaluating the full data set. This resembles the earlier argument problem in [Figure 1], where a weak premise can lead to a flawed conclusion.
Engineers often discover that users interact with a product in ways designers did not predict. Real-world testing can reveal failures that never appeared in ideal lab conditions.
The best challenge questions are specific. Instead of saying "This seems wrong," ask "What evidence supports that premise?" Instead of saying "That graph is misleading," ask "Why does the axis start at \(50\) rather than \(0\)?" Instead of saying "This design is bad," ask "Which criterion does it fail to meet under realistic conditions?"
Useful question stems include: What assumption is being made? What evidence would strengthen this claim? What alternative explanation fits the data? How representative is the sample? Which variables were controlled? What is the trade-off? Who benefits, and who may be left out? Under what conditions would this design fail?
These questions are especially powerful when they remain respectful and evidence-based. In science and engineering, critique aims to improve models, experiments, and designs. It is possible to challenge a claim strongly while still being fair.
One sign of maturity in reasoning is being willing to revise your own view. If new evidence answers your questions well, then the claim becomes stronger. If not, then your skepticism was useful. Either way, the goal is better understanding.
The habit of challenging premises, data interpretations, and design suitability transfers across subjects. In biology, you ask whether a pattern in populations has enough evidence behind it. In physics, you ask whether the experimental setup isolates the variable of interest. In engineering, you ask whether the prototype fits the true problem. In social issues, you ask whether data are representative and whether conclusions go beyond what the evidence justifies.
As shown earlier in [Figure 3], fair tests depend on controlling variables, and as shown in [Figure 2], fair interpretations depend on presenting evidence honestly. Together, these habits make your thinking more accurate, more careful, and more useful.
When you ask strong challenge questions, you are doing more than finding flaws. You are helping build explanations that are more precise, experiments that are more reliable, and designs that are more effective in the real world.