How can you tell whether a scooter will keep rolling farther than a skateboard, or whether one paper parachute works better than another? You do not have to guess. Scientists and engineers gather information carefully, then use that information as evidence. When we observe and measure, we collect data that helps us explain what is happening in the world and decide whether a design solution works well.
Scientists study phenomena, which are things that happen in nature or in the world around us. A phenomenon could be a ball bouncing, a swing slowing down, sugar dissolving in water, or a toy car speeding down a ramp. Engineers solve problems by creating and improving things people use. They also need data to know which design works best.
An observation is something you notice with your senses or with tools. You might observe that a ball rolls straight, that a car speeds up downhill, or that one parachute falls more slowly than another. A measurement is information you collect using numbers and units, such as length, time, mass, or temperature. When we put observations and measurements together, we create data.
Data are pieces of information collected during an investigation. Evidence is the part of the data that supports an explanation or helps us decide whether a design solution is successful.
Not all data are equally useful. If measurements are messy, rushed, or unfairly collected, then the evidence may not be strong. Good evidence comes from careful work. That means measuring the same way each time, recording results clearly, and repeating trials when needed.
Some observations are qualitative, which means they describe qualities. For example, "the ball moved smoothly" or "the parachute spun as it fell." Some observations are quantitative, which means they use numbers, such as "the ball traveled \(150 \textrm{ cm}\)" or "the parachute fell in \(3 \textrm{ s}\)." Both kinds are useful, but measurements are especially powerful because numbers make it easier to compare results.
To make good measurements, scientists use tools such as rulers, metersticks, stopwatches, balances, and thermometers. The unit matters too. A distance might be measured in \(\textrm{cm}\) or \(\textrm{m}\), and time might be measured in seconds. If one group measures in centimeters and another in meters, they must be clear about which unit they used.
You already know that a force is a push or a pull. Forces can change an object's motion by starting it, stopping it, speeding it up, slowing it down, or changing its direction. Careful observations and measurements help us notice these changes.
A fair test means changing only one thing at a time while keeping other important things the same. If you want to know whether a steeper ramp makes a toy car go farther, then the toy car should stay the same, the starting point should stay the same, and the floor surface should stay the same. The ramp steepness is the one thing you change.
Repeated trials are also important. If a toy car rolls \(120 \textrm{ cm}\) one time and \(125 \textrm{ cm}\) another time, that is normal. Small differences can happen because of tiny changes in the release, the floor, or the measurement. Doing several trials helps you see the overall pattern better.
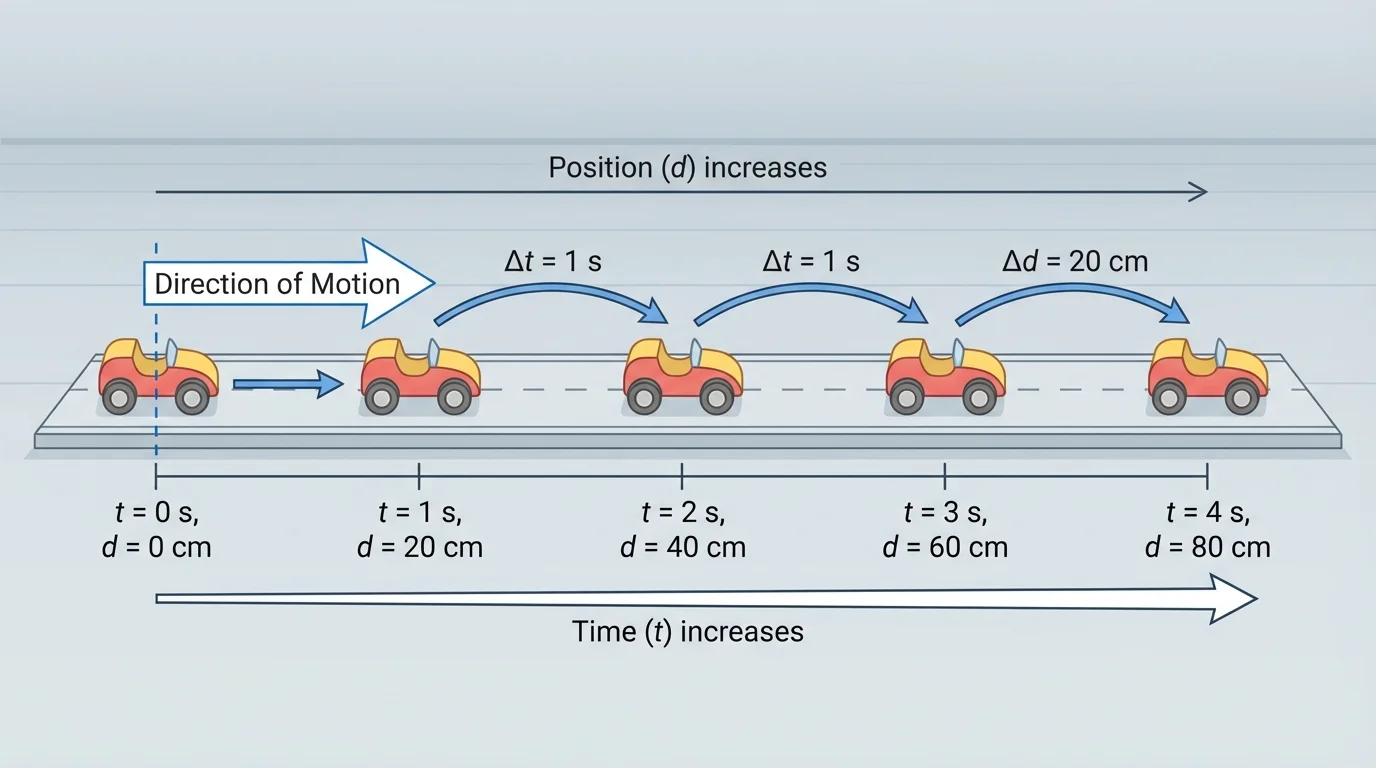
Motion means a change in position over time. When scientists study motion, they often look for a pattern, as shown in [Figure 1], because repeated observations of where an object is at equal times can help predict where it will be next. If a toy car moves about the same distance every second, then we can use that pattern to make a prediction.
Suppose a ball rolls across the floor. You check its position at one-second intervals. If the ball is at \(20 \textrm{ cm}\), then at \(40 \textrm{ cm}\), then at \(60 \textrm{ cm}\), the pattern suggests it is moving about \(20 \textrm{ cm}\) each second. That means after another second, it will probably be near \(80 \textrm{ cm}\). The pattern does not make the motion exact every time, but it gives evidence for a good prediction.
Patterns in motion can also show when something is speeding up or slowing down. If a marble rolls \(10 \textrm{ cm}\) in the first second, \(20 \textrm{ cm}\) in the next second, and \(30 \textrm{ cm}\) in the next, the distances are increasing. That suggests the marble is speeding up. If the distances get smaller each second, the object is slowing down.
These patterns help explain phenomena. For example, a ball rolling on carpet slows down faster than a ball rolling on smooth tile. The observations and measurements support the explanation that the surface affects how motion changes. Later, when we compare design solutions, we use the same kind of careful thinking.
Professional athletes and coaches use motion data regularly. They measure how fast a runner starts, how far a basketball travels, and how the angle of a kick affects where the ball goes.
As in [Figure 1], equal time checks are especially useful because they make the pattern easier to see. If you only check at random times, it becomes much harder to tell whether an object is moving steadily, speeding up, or slowing down.
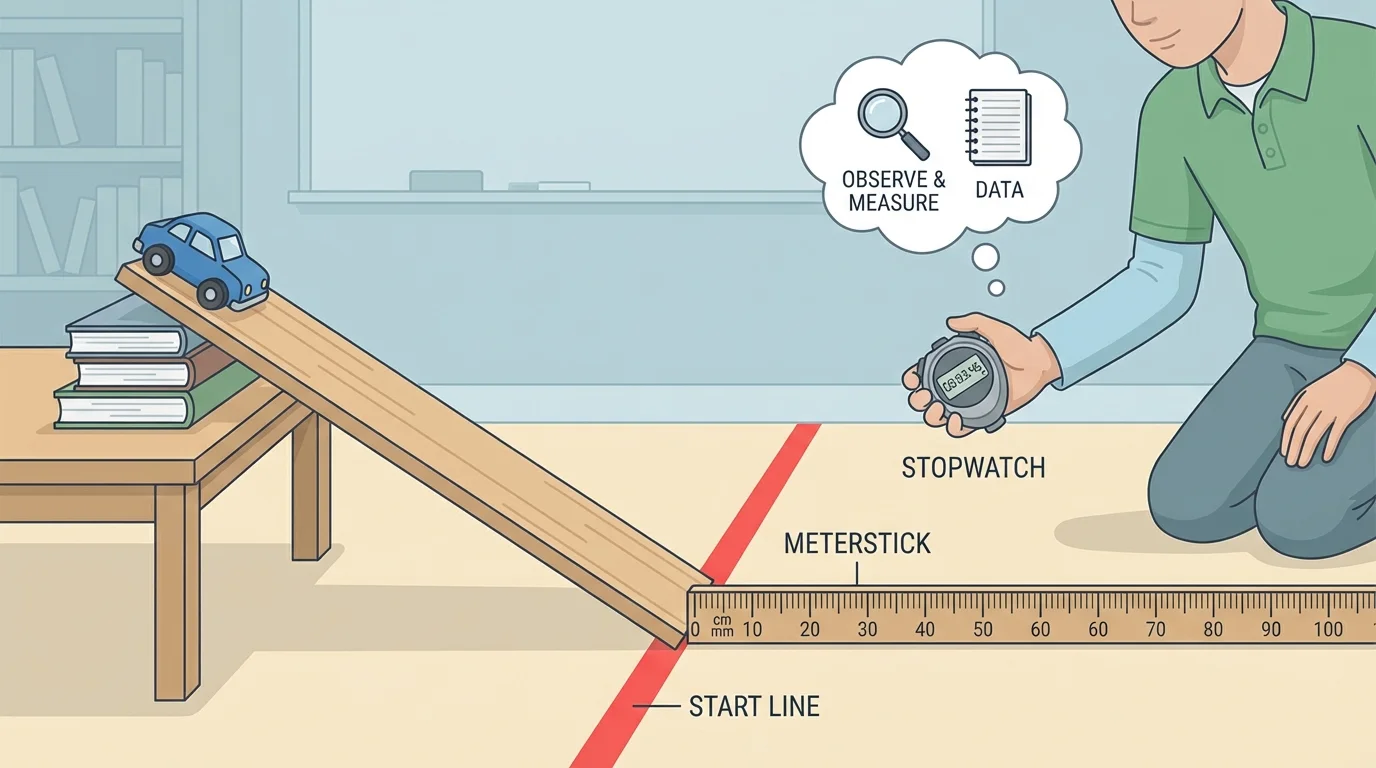
A simple ramp investigation makes a strong example of how data can become evidence. In this setup, shown in [Figure 2], a toy car starts from the same point on a ramp each time, rolls down, and continues across the floor while students measure how far it travels. This helps answer a question such as: Does raising the ramp higher make the car travel farther?
To make the test fair, students use the same toy car, the same floor, and the same release point on the ramp. They only change the ramp height. They might test a low ramp and a high ramp, then measure the distance the car travels after leaving the ramp.
Toy car investigation
Here is one set of sample data.
Step 1: Measure the distances for a low ramp.
Trial distances: \(90 \textrm{ cm}\), \(95 \textrm{ cm}\), and \(93 \textrm{ cm}\).
Step 2: Measure the distances for a high ramp.
Trial distances: \(140 \textrm{ cm}\), \(145 \textrm{ cm}\), and \(143 \textrm{ cm}\).
Step 3: Compare the results.
The low-ramp distances are all close to about \(93 \textrm{ cm}\). The high-ramp distances are all close to about \(143 \textrm{ cm}\).
The evidence supports the explanation that a higher ramp makes the toy car travel farther.
Notice that the explanation is based on data, not on opinion. If someone says, "I think the higher ramp is faster," that is only an idea. When the distances are measured and recorded, the explanation becomes stronger because it is supported by evidence.
You can also measure time. If the car reaches the finish line in less time on the steeper ramp, that adds more evidence that the motion changes when the ramp height changes. Scientists often collect more than one kind of data to build a stronger explanation.
Engineers do not just describe what happens; they test ideas to solve problems. A fair comparison, as shown in [Figure 3], helps engineers decide which design works better. Suppose the problem is to make a paper parachute that falls slowly and safely carries a paperclip.
One design might have a large canopy, and another might have a small canopy. To test these designs fairly, the paperclip mass should stay the same, the drop height should stay the same, and the way the parachute is released should stay the same. Only the design feature being tested should change.
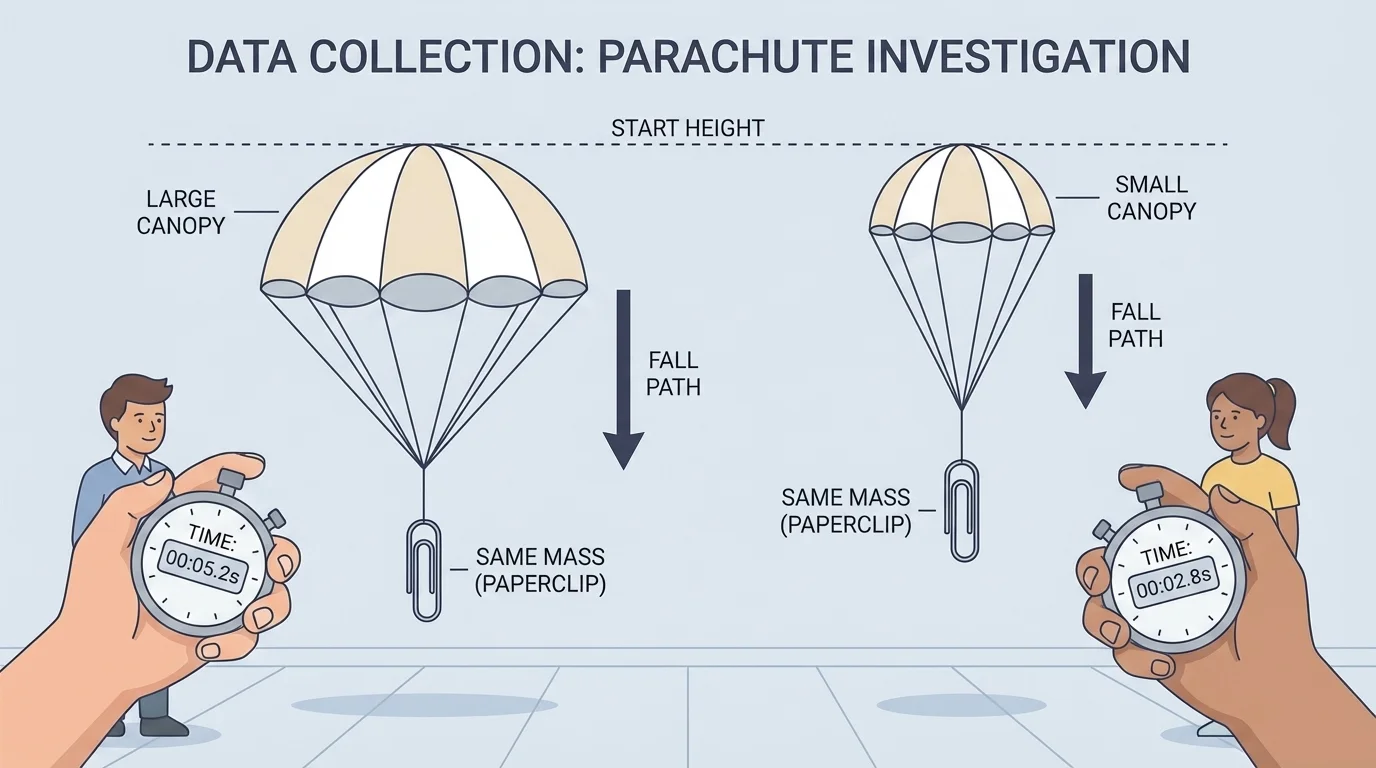
Now imagine the large parachute falls in \(4 \textrm{ s}\), \(4.2 \textrm{ s}\), and \(4.1 \textrm{ s}\), while the small parachute falls in \(2.8 \textrm{ s}\), \(2.9 \textrm{ s}\), and \(3 \textrm{ s}\). The pattern shows that the larger parachute takes longer to fall. That means it slows the fall better in this test.
How design testing uses evidence
When engineers test a design solution, they collect data, compare results, and decide which design best solves the problem. The best design is not chosen because it looks nicer or seems better. It is chosen because the evidence shows it performs better.
Engineers then improve the design. They may ask new questions: Would a different string length work better? Would another shape work better? Each new question needs new observations and measurements.
Later, when you compare other designs, such as stronger bridges made from paper or boats made from aluminum foil, the same idea from [Figure 3] still matters: change one feature, keep other conditions the same, and use measured data to decide.
Data become much easier to understand when they are organized in a clear way. Scientists often use notebooks, charts, and tables. A table helps you see comparisons quickly and keeps measurements from getting mixed up.
| Ramp Height | Trial 1 Distance | Trial 2 Distance | Trial 3 Distance |
|---|---|---|---|
| Low | \(90 \textrm{ cm}\) | \(95 \textrm{ cm}\) | \(93 \textrm{ cm}\) |
| High | \(140 \textrm{ cm}\) | \(145 \textrm{ cm}\) | \(143 \textrm{ cm}\) |
Table 1. Distance data from a toy car investigation using two ramp heights.
Sometimes students also find a typical result by looking for the median or by calculating a simple average. For the low ramp, the average distance is \((90 + 95 + 93) \div 3 = 278 \div 3\), which is about \(92.7 \textrm{ cm}\). For the high ramp, the average distance is \((140 + 145 + 143) \div 3 = 428 \div 3\), which is about \(142.7 \textrm{ cm}\). These values help compare the two ramp heights in one quick glance.
Organizing parachute data
Step 1: Record each trial clearly.
Large parachute: \(4 \textrm{ s}\), \(4.2 \textrm{ s}\), \(4.1 \textrm{ s}\).
Small parachute: \(2.8 \textrm{ s}\), \(2.9 \textrm{ s}\), \(3 \textrm{ s}\).
Step 2: Look for the pattern.
Every large-parachute time is greater than every small-parachute time.
Step 3: Use the pattern as evidence.
The larger parachute consistently falls more slowly, so it meets this goal more effectively.
Labels are important too. If you forget to label which data belong to which test, the evidence becomes confusing. Clear tables, good headings, and units help other people understand and trust your results.
Scientists often build explanations in three parts: a claim, evidence, and reasoning. The claim is what you think the data show. The evidence is the measured information. The reasoning explains why the evidence supports the claim.
For example, a claim might be: The steeper ramp causes the toy car to travel farther. The evidence is that the car traveled about \(90\) to \(95 \textrm{ cm}\) on the low ramp and about \(140\) to \(145 \textrm{ cm}\) on the high ramp. The reasoning is that the higher ramp led the car to travel farther after leaving the ramp, and the repeated measurements showed a consistent increase in distance.
"Good explanations are built from evidence, not guesses."
An explanation becomes stronger when the data are repeated and the pattern is clear. If the results are very mixed, you may need to repeat the investigation, improve the measuring, or check whether the test was fair. This is a normal part of science and engineering.
Sometimes measurements are not accurate because the starting point moves, the ruler is not lined up correctly, or the timer starts late. A student might also push the toy car by accident instead of letting it go gently from the same place each time. These small mistakes can change the data.
One way to improve data is to use a consistent procedure. Mark the starting line. Place the ruler in the same position every trial. Release the object the same way every time. Record the result right away so it is not forgotten.
Another helpful strategy is to repeat trials and compare them. If two trials are close and one is very different, that unusual result may need checking. This does not mean you should hide data. It means you should investigate why the result was different and make sure your testing method is careful.
The motion pattern from [Figure 1] also reminds us that measurements are most useful when the timing is consistent. If you measure position every \(1 \textrm{ s}\), the pattern is easier to interpret than if you measure after random time gaps.
Observations and measurements are used everywhere. On a playground, you can notice that a swing moves back and forth in a pattern. In traffic, engineers measure how cars move so they can design safer roads. In sports, coaches measure speed, distance, and time to help athletes improve. In weather science, tools measure wind, rain, and temperature so meteorologists can make better predictions.
Engineers also test design solutions in daily life. Bike helmets are tested to protect heads better. Shoe designers test grip to reduce slipping. Builders test materials to learn which designs are strongest. In each case, data serve as the basis for deciding what works.
Space scientists track the motion of planets, moons, and spacecraft by making repeated observations over time. Patterns in those observations help them predict where objects in space will be later.
Whether you are studying a rolling ball, a dissolving solid, or a better parachute design, the big idea stays the same: careful observations and measurements produce data, and data become evidence for an explanation or a design decision.