Almost all of Earth's water is too salty to drink. That surprises many students, because Earth looks like a blue, watery planet from space. But when scientists measure where water is found, they discover something important: most water is in the oceans, and only a small part is freshwater. To understand that pattern, scientists need to describe amounts carefully and often use measurements of surface area and volume. That is where area and volume become powerful tools.
Science is full of questions about how much. How much water is in a lake? How much ice covers a glacier? How much rainwater could a schoolyard collect? To answer those questions, scientists measure shapes and spaces. Some questions are about flat surfaces, such as the size of a wetland seen from above. Other questions are about how much space something fills, such as the amount of water in a reservoir.
Measurements help turn observations into evidence. If someone says, "There is a lot of water underground," that is only a claim. If scientists measure and graph the amount of water in groundwater compared with rivers and lakes, they can support that claim with data.
Area is the amount of surface a flat shape covers. It is measured in square units, such as square centimeters or square meters.
Volume is the amount of space a three-dimensional object or substance takes up. It is measured in cubic units, such as cubic centimeters or cubic meters.
Reservoir in Earth science means a place where water is stored, such as oceans, glaciers, groundwater, lakes, rivers, and the atmosphere.
When we talk about Earth's water, scientists study both area and volume. For example, the area of sea ice tells how much surface is covered, while the volume of water in an ocean basin tells how much water is stored there.
Area is used for flat surfaces. If a pond covers a region that is \(5\) meters long and \(4\) meters wide, its area is found by multiplying length by width:
\[A = l \times w\]
If the pond is rectangular, then with length \(5\) and width \(4\), the area is \(5 \times 4 = 20\) square meters, written as \(20 \textrm{ m}^2\).
Volume is used for objects or substances that fill space. A water tank, for example, has length, width, and height. For a rectangular tank, the formula is
\[V = l \times w \times h\]
If the tank is \(3\) meters long, \(2\) meters wide, and \(1\) meter high, then the volume is \(3 \times 2 \times 1 = 6\) cubic meters, written as \(6 \textrm{ m}^3\).
These ideas may seem like math, but they are also science tools. They help us compare lakes, estimate water storage, and understand Earth's systems.
Square units measure a surface. Cubic units measure space. A square meter, \(1 \textrm{ m}^2\), is different from a cubic meter, \(1 \textrm{ m}^3\). They do not mean the same thing.
Scientists choose measurements that fit the question. If they want to know how much land a flood covers, area is useful. If they want to know how much water is stored behind a dam, volume is more useful.
[Figure 1] Earth's water is stored in several places, and each place is a reservoir. The biggest reservoir is the ocean, which holds saltwater. Freshwater is found in glaciers, ice caps, groundwater, lakes, rivers, and even the atmosphere. Scientists compare these amounts to understand the distribution of water on Earth.
A simple way to describe the pattern is this: about \(97\%\) of Earth's water is saltwater, and about \(3\%\) is freshwater. But even that \(3\%\) is not all easy to use. Much of it is frozen in glaciers and ice caps or stored underground.
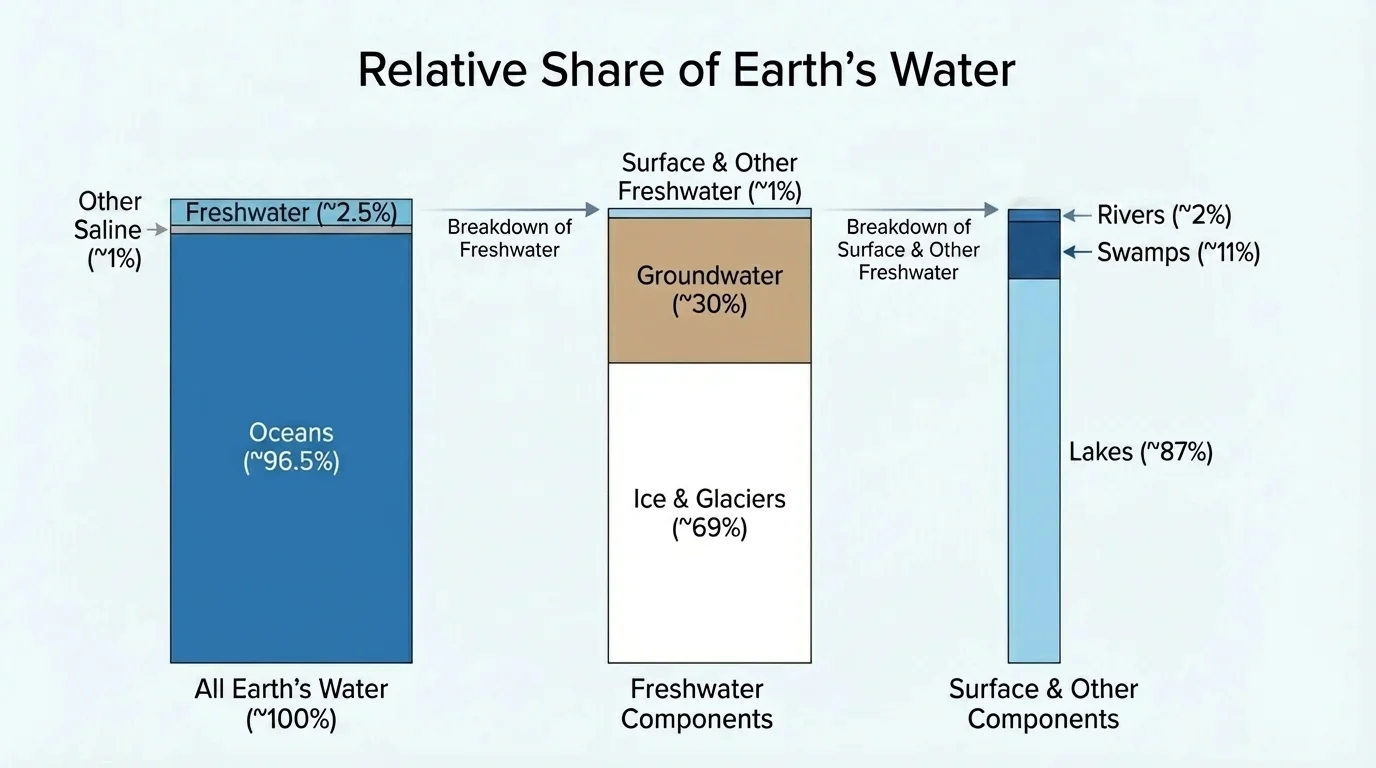
Only a tiny part of Earth's water is found in rivers and lakes, even though those are the places people often notice most. This is an important scientific idea: the most visible water is not always the largest amount.
Scientists often use percentages to compare reservoirs. For example, if total Earth water were shown as \(100\) equal parts, about \(97\) parts would be ocean water and about \(3\) parts would be freshwater. If that freshwater were split again, most would be in ice and groundwater, while very little would be surface water.
| Water reservoir | Type of water | Relative amount |
|---|---|---|
| Oceans | Mostly saltwater | Largest share |
| Glaciers and ice caps | Freshwater | Large share of freshwater |
| Groundwater | Freshwater | Large share of freshwater |
| Lakes and rivers | Freshwater | Very small share |
| Atmosphere | Freshwater | Tiny share |
Table 1. Major water reservoirs on Earth and their relative amounts.
This distribution matters because people, plants, and animals depend on available freshwater. Looking again at [Figure 1], we can see why water supply can become a problem even on a planet covered with water.
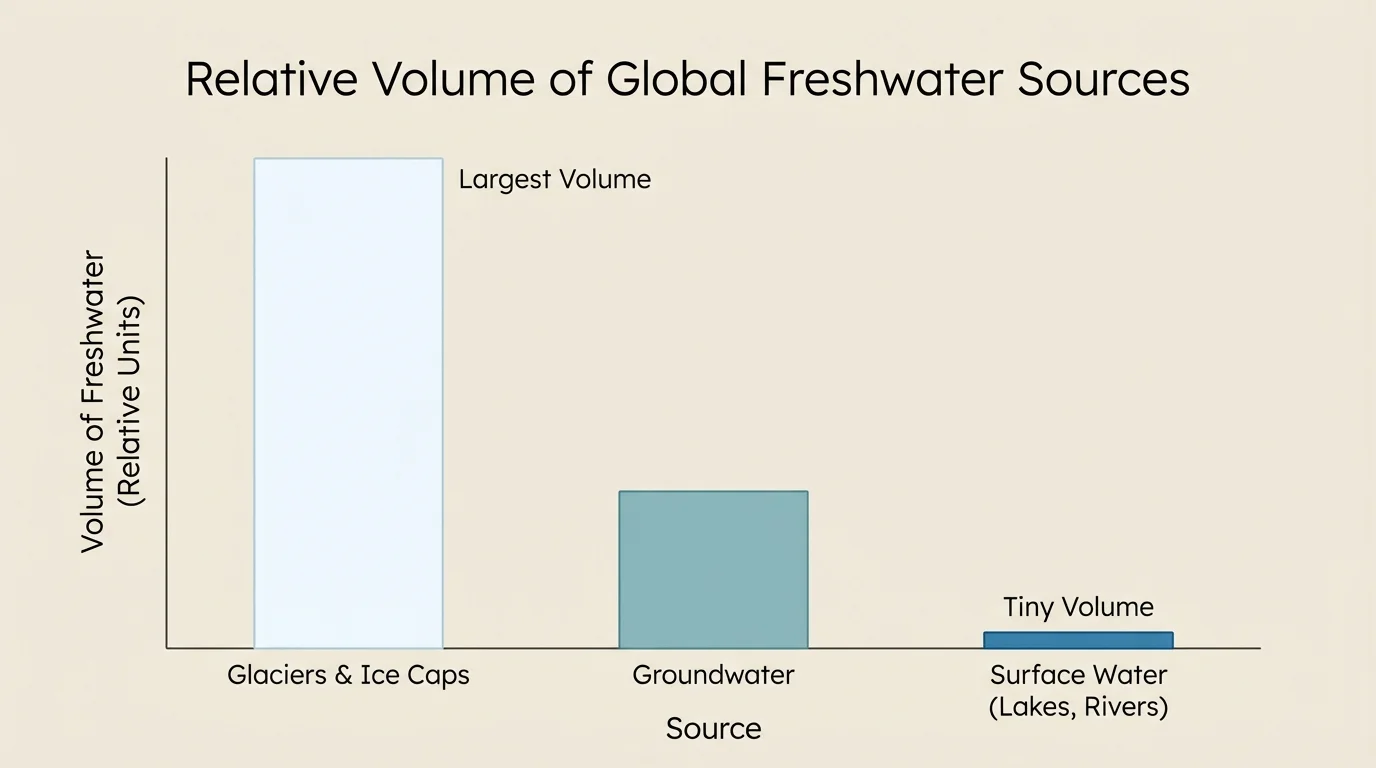
[Figure 2] A graph helps us see data quickly. When scientists compare water reservoirs, they often use bar graphs or pie charts. A bar graph is especially useful when one amount is much bigger than another, such as when comparing freshwater stored in ice, groundwater, and surface water.
In a bar graph, each bar has a height that matches a quantity. If glaciers store more freshwater than lakes and rivers, the glacier bar is much taller. This makes the comparison easy to see.
A pie chart can also show parts of a whole. If Earth's total water is the whole circle, then the ocean section would cover most of the circle, and the freshwater section would be small. Pie charts are good for percentages, but bar graphs are often easier when students need to compare differences carefully.
Why graphing matters in science
Graphs do more than make data look neat. They help scientists notice patterns, compare quantities, and explain evidence clearly. A graph can show in seconds what might take many sentences to describe.
Suppose a scientist records these freshwater amounts in made-up units: glaciers \(68\), groundwater \(30\), and surface water \(2\). A graph of these values shows immediately that glaciers hold the most and surface water holds the least. The numbers alone are useful, but the graph helps your eyes compare them faster.
Later, when discussing water access or drought, scientists can return to the same pattern seen in [Figure 2]: even though lakes and rivers are important for life, they contain only a tiny fraction of freshwater.
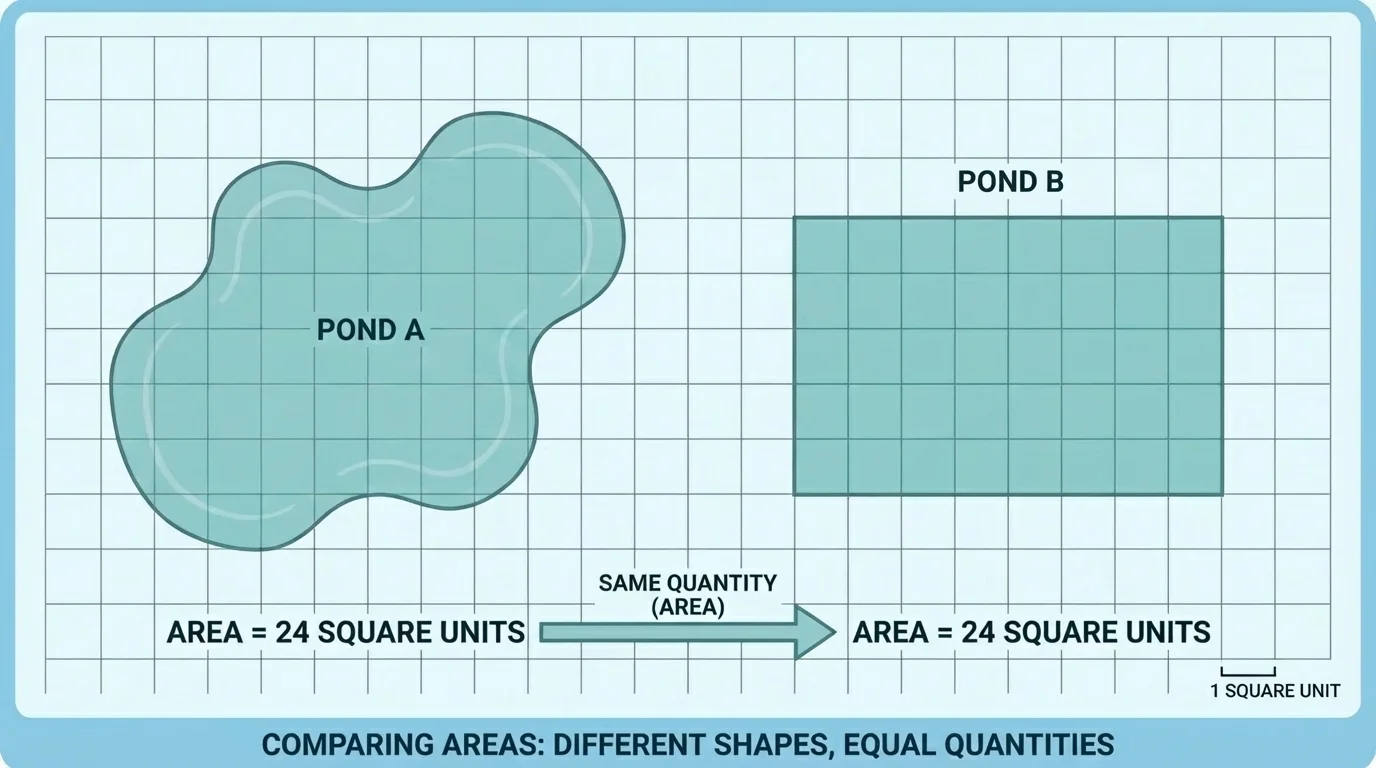
Sometimes scientists care about how much surface is covered. [Figure 3] This is where area is important. A frozen lake, a floodplain, or a wetland can all be studied by measuring surface coverage. Pond shapes may look different, but if they cover the same number of square units, they have the same area.
Area can be measured directly on a map or on a grid. If a small marsh covers \(12\) squares and each square represents \(1 \textrm{ m}^2\), then the marsh area is \(12 \textrm{ m}^2\).
This helps answer questions such as, "Which lake has a larger surface?" or "How much land is underwater after heavy rain?" In Earth science, satellites often measure area from above. For example, the area of sea ice can be compared from month to month to study seasonal change.
Scientific example: finding the area of a rectangular pond
A school pond is \(8 \textrm{ m}\) long and \(5 \textrm{ m}\) wide. What is its area?
Step 1: Choose the area formula for a rectangle.
\(A = l \times w\)
Step 2: Substitute the measurements.
\(A = 8 \times 5\)
Step 3: Multiply.
\(A = 40\)
The pond covers \[40 \textrm{ m}^2\]
Area does not tell how deep the pond is. Two ponds can have the same area but different amounts of water. That is why scientists often need volume too.
When we compare maps or satellite images, [Figure 3] reminds us that different shapes can still cover the same total surface.
Volume is used when scientists ask how much space water fills. [Figure 4] A tank model makes this idea easy to picture. Reservoirs, aquariums, rain barrels, and some underground water spaces can all be described with volume.
For rectangular containers, volume is found by multiplying length, width, and height.
\[V = l \times w \times h\]
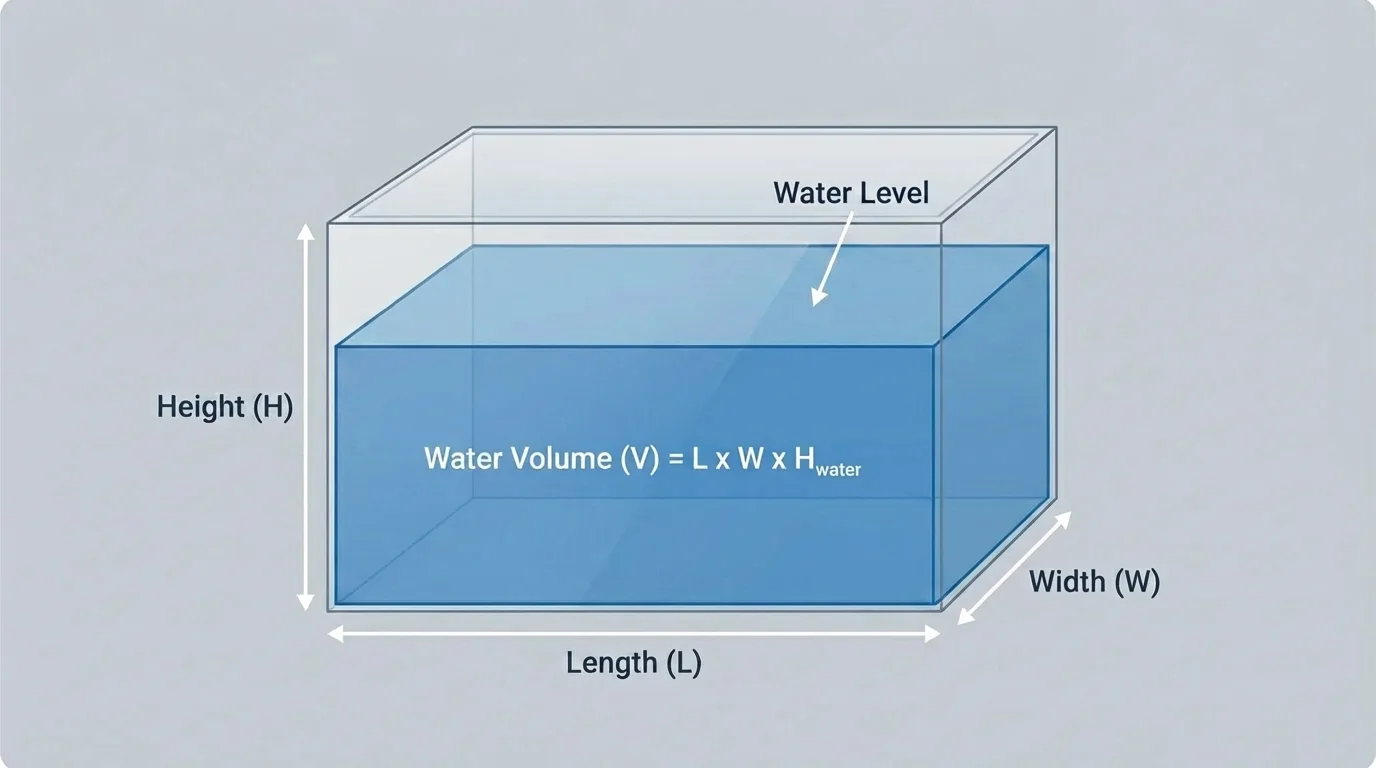
If a rain tank is \(2 \textrm{ m}\) long, \(1.5 \textrm{ m}\) wide, and \(1 \textrm{ m}\) high, then its volume is \(2 \times 1.5 \times 1 = 3\), so the tank can hold \(3 \textrm{ m}^3\) of water.
Volume is especially important when surface size is not enough. A reservoir may have a large area but be shallow, while another has a smaller area but is deep. The deeper one could hold more water.
Scientific example: finding the volume of a tank
A science center has a tank that is \(4 \textrm{ m}\) long, \(3 \textrm{ m}\) wide, and \(2 \textrm{ m}\) high. What is its volume?
Step 1: Use the volume formula.
\(V = l \times w \times h\)
Step 2: Substitute the values.
\(V = 4 \times 3 \times 2\)
Step 3: Multiply.
\(V = 24\)
The tank volume is \[24 \textrm{ m}^3\]
Scientists may estimate the volume of natural water bodies in more complex ways, but the main idea is the same: volume measures how much space the water occupies. The tank in [Figure 4] gives a clear model for thinking about this.
Let's connect measurement and graphing to scientific questions about Earth's water.
Example: comparing saltwater and freshwater with percentages
Suppose Earth's water is represented by \(100\) liters in a model. If \(97\%\) is saltwater and \(3\%\) is freshwater, how many liters of each are there?
Step 1: Find saltwater.
\(97\%\) of \(100\) liters is \(97\) liters.
Step 2: Find freshwater.
\(3\%\) of \(100\) liters is \(3\) liters.
In this model, Earth has \(97\) liters of saltwater and \(3\) liters of freshwater.
This model shows why freshwater is precious. Even on a water-rich planet, the usable part is limited.
Example: reading a bar graph of freshwater reservoirs
A graph shows freshwater stored as follows: glaciers \(70\) units, groundwater \(29\) units, lakes and rivers \(1\) unit. Which reservoir stores the most freshwater, and how much more than lakes and rivers?
Step 1: Identify the greatest value.
The greatest value is \(70\), so glaciers store the most.
Step 2: Compare glaciers with lakes and rivers.
\(70 - 1 = 69\)
Glaciers store the most freshwater, and they store \(69\) more units than lakes and rivers.
This kind of comparison helps scientists explain why rivers and lakes are important but limited.
Measurements are only useful when they are clear. Every graph should have a title, labeled axes, and units when needed. If a graph compares area, the units might be square kilometers. If it compares volume, the units might be cubic meters or liters.
Scale matters too. If the scale changes suddenly, a graph can make small differences look huge or big differences look small. Scientists read graphs carefully so they do not draw the wrong conclusion.
Earth's atmosphere holds only a tiny amount of water compared with the oceans, but that small amount moves quickly through the water cycle as evaporation, condensation, and precipitation.
A good question to ask is, "What exactly is being measured?" A lake's area and a lake's volume tell different stories. Area tells how much surface is covered. Volume tells how much water is stored.
This is why careful data reading is part of real science. Two reports about the same reservoir may both be correct if one gives area and the other gives volume.
Area and volume measurements are used in everyday science and engineering. Farmers track how much water is stored in ponds. City planners estimate how much rainwater streets and drains must carry. Environmental scientists measure the area of shrinking wetlands. Climate scientists measure sea ice area to understand changes over time.
These measurements also help communities prepare for drought. If a reservoir's volume drops from \(50 \textrm{ m}^3\) to \(35 \textrm{ m}^3\), scientists know the water supply is decreasing. If the flooded area after a storm grows from \(200 \textrm{ m}^2\) to \(450 \textrm{ m}^2\), emergency workers know a larger region is affected.
Evidence from measurement
Scientific claims become stronger when they are supported by measured quantities and clear graphs. Saying that "most freshwater is frozen or underground" becomes evidence-based when data and graphs show exactly how the freshwater is distributed.
Earth science often depends on combining observation, measurement, and graphing. Students who can describe area and volume clearly are building the same skills scientists use to answer big questions about our planet.
Area measures a surface, while volume measures space. Graphs help organize data so patterns are easier to see. Earth's water is not evenly distributed, and most of it is saltwater. Of the freshwater that exists, much is stored in ice or underground rather than in rivers and lakes.
When you choose the right kind of measurement and show it clearly, you can answer scientific questions with evidence instead of guesses.