A weather app can warn people about rain before the first drop falls. A coach can estimate how far a soccer ball will travel from the angle of a kick. A doctor can use body data to track how a disease might spread. None of these people can see the future, but they can use models to make smart predictions and clear explanations. A model is one of the most powerful tools in science because it helps us understand things that are too big, too small, too fast, too slow, or too complicated to study all at once.
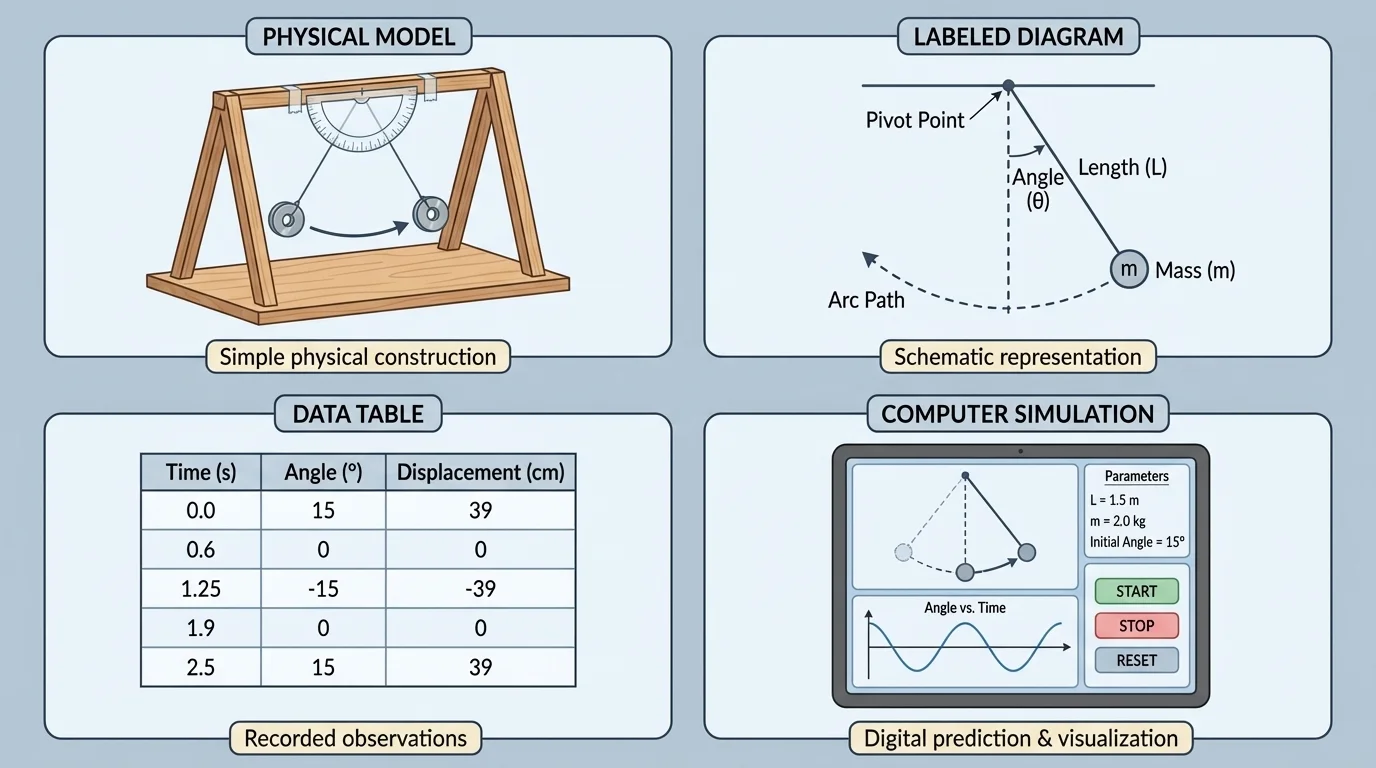
A model is a simplified representation of something real. It may represent an object, a system, or a process. Scientists use models to focus on the most important parts of a phenomenon without including every tiny detail. One real thing can be represented in several ways, as [Figure 1] shows with different forms of the same idea.
Some models are physical, such as a globe representing Earth or a small bridge made from craft sticks to test strength. Some are diagram models, such as a drawing of the water cycle. Some are mathematical, using numbers and relationships. Some are computer models that can change quickly when new information is added.
A good model is not a perfect copy. In fact, if a model included absolutely everything, it would be just as hard to study as the real thing. Instead, a model keeps the most useful features. If students use a model of the solar system, the model may show planet order and orbit paths, but it may not show exact sizes or distances because those would be difficult to fit in a classroom.
Model means a simplified representation of an object, system, or process that helps people explain or predict what happens.
Phenomenon means an event or pattern that can be observed, such as shadows changing during the day, ice melting, plants growing, or clouds forming.
Models are everywhere, not only in science class. A map is a model of a place. A recipe is a model for preparing a dish in a certain way. A toy car in a wind tunnel can be a model used to learn about a real car. Even a schedule can act like a model of how time will be used during a day.
We use models because real systems can be difficult to observe directly. Some things are too large, like climate systems across Earth. Some things are too small, like cells and atoms. Some things are dangerous, like hurricanes, volcanoes, or disease outbreaks. A model lets us study these safely and carefully.
Models help us do two major jobs. First, they help us describe phenomena. A diagram of the water cycle helps explain how water evaporates, condenses, and falls as precipitation. Second, they help us predict phenomena. If we know the pattern of a plant's growth over several days, we may predict its height tomorrow.
Models also save time and materials. Engineers often test a design with a model before building the full object. This lowers costs and reduces waste. Scientists can change one part of a model at a time to see what happens, which is often easier than changing the real system.
Weather forecasts are built from huge computer models that use measurements of temperature, wind, air pressure, and water vapor from many places at once. Even with powerful computers, forecast models still need updates because Earth's atmosphere changes constantly.
When a model works well, it gives us useful information. When it does not work well, it still teaches us something, because it shows where our understanding needs improvement.
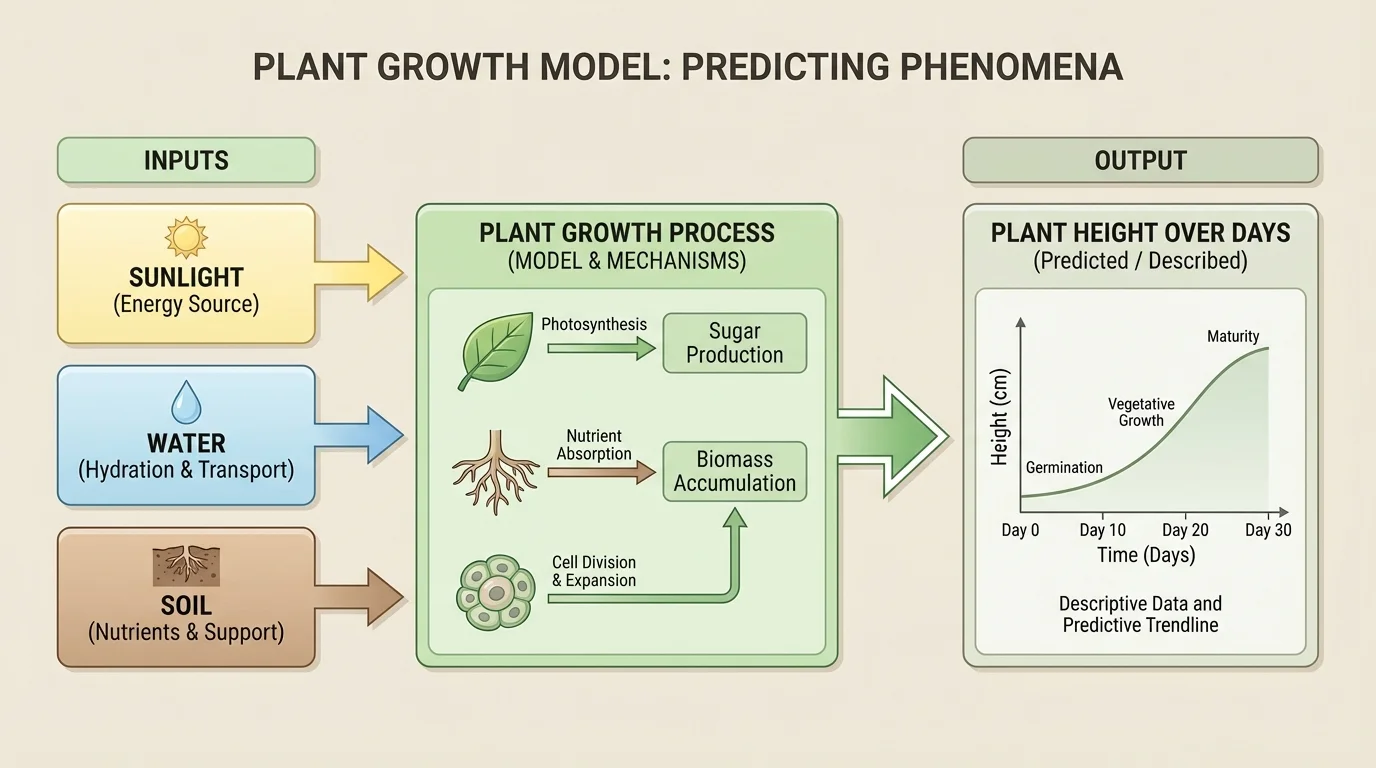
[Figure 2] To build a model, we need to decide which parts of the phenomenon matter most. In a simple plant-growth model, we might pay attention to sunlight, water, soil, and plant height. We do not need to include every ant walking by the pot, because that may not matter for the question we are studying.
A variable is something that can change. If a plant gets different amounts of water each day, then water is a variable. Height is also a variable because the plant's height changes over time. In many models, one variable affects another.
Many models have inputs and outputs. Inputs are the things that go into the system or are changed by the user. Outputs are the results the model gives. For a plant model, water and sunlight can be inputs, while plant height after one week can be the output.
Another important part is an assumption. An assumption is something we accept as true for the model to work. For example, a simple plant model might assume that the temperature stays about the same each day. If the temperature changes a lot, the model may become less accurate.
Every model also has limitations. A limitation is something the model cannot do well. A globe shows Earth's shape better than a flat map, but it does not show every road. A map can show roads clearly, but it changes Earth's curved surface into a flat one. The choice of model depends on the purpose.
| Part of a model | What it means | Example |
|---|---|---|
| Variable | Something that can change | Hours of sunlight |
| Input | Information put into the model | Amount of water each day |
| Output | Result produced by the model | Plant height after one week |
| Assumption | Something treated as true in the model | Temperature stays similar |
| Limitation | Something the model does not include well | Model ignores insects or disease |
Table 1. Key parts of a model and simple examples from a plant-growth system.
Scientists and engineers do not guess randomly when they make a model. They follow a process. First, they observe a phenomenon and ask a clear question. For example: "How does the amount of sunlight affect the height of a bean plant?" That question helps decide what information is important.
Next, they choose the main parts of the system. They may decide to measure sunlight in hours per day and plant height in centimeters. Then they collect data. Suppose one plant gets less sunlight and another gets more. After several days, students record the heights and look for a pattern.
After gathering data, they make a representation. This could be a drawing, a flowchart, a table, a graph, or even a simple rule. For instance, if a plant grows about the same amount each day, a student might model the height after several days with a relationship like "starting height plus daily growth."
How a model grows stronger
A model becomes more useful when it is tested with evidence. If the prediction matches what really happens, the model may be reliable for that situation. If it does not match, the model is changed. Scientists expect to revise models many times. Improving a model is a normal part of science, not a sign of failure.
Finally, they test the model. They ask, "Does this model explain what we saw?" and "Can it correctly predict a new result?" If not, they return to earlier steps and improve it.
Some models are mainly used to explain what is happening. A labeled diagram of the water cycle describes how water moves from oceans and lakes into the air and back to Earth. It helps students see the relationships among evaporation, condensation, clouds, and precipitation.
A model of the Moon's phases can also describe a phenomenon. The model shows that the Moon does not change shape. Instead, the part we see lit by the Sun changes as the Moon moves around Earth. A simple ball and flashlight can act as a physical model for this idea.
Food webs are another kind of descriptive model. They show who eats whom in an ecosystem. A food web does not show every exact event in nature, but it helps explain relationships between plants, insects, birds, and larger animals. This kind of model describes how energy moves through living things.
Descriptive models are especially helpful when we need to understand systems with many connected parts. As we saw earlier in [Figure 1], different forms of a model can represent the same real thing. A diagram may be best for showing parts, while a physical model may be best for showing shape or movement.
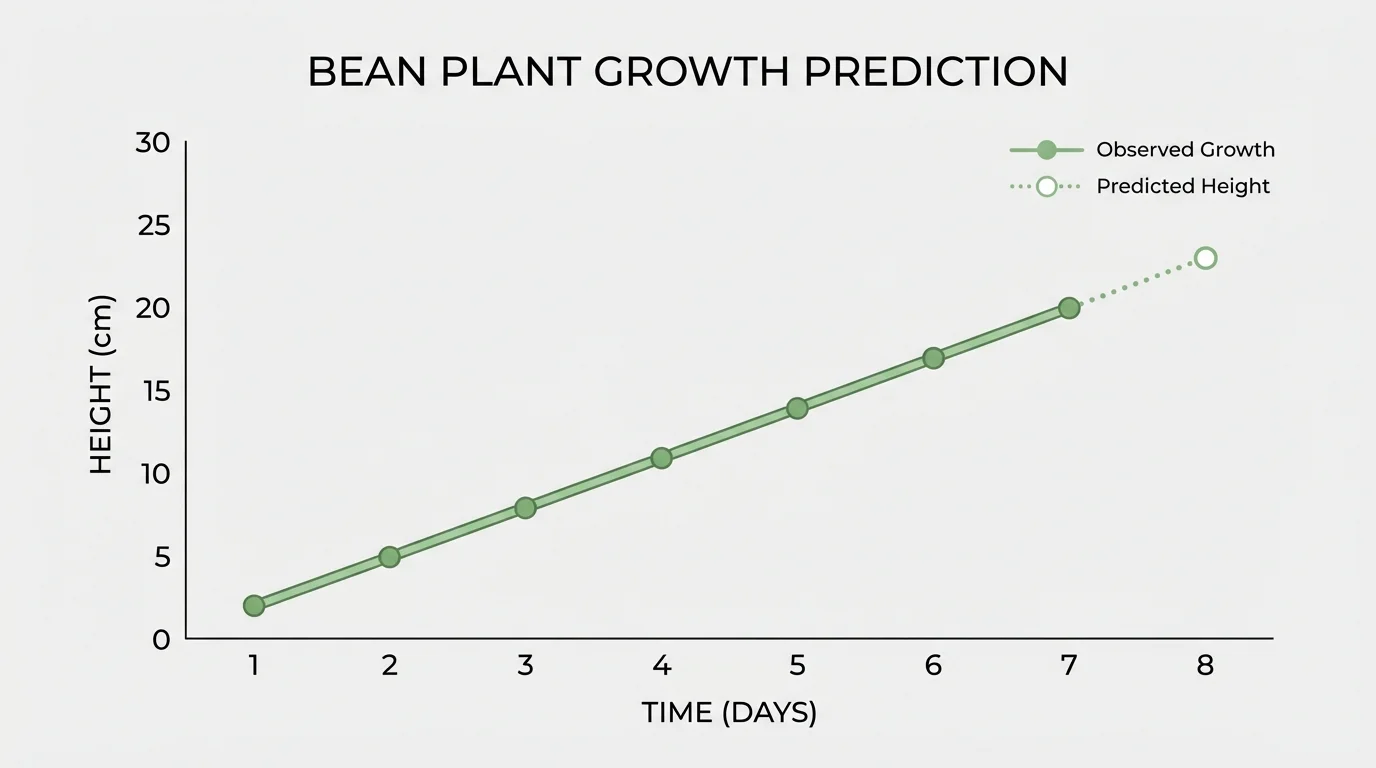
[Figure 3] Other models are built mainly to make a prediction. A prediction is a statement about what is likely to happen based on evidence and patterns. When students use a graph to spot a trend, they are using a model to extend the pattern into the future.
Suppose a bean plant is measured for seven days. If the plant grows by about the same amount each day, we can use that pattern to predict the next height. A simple model may say:
If daily growth is about \(2 \textrm{ cm}\) and today's height is \(10 \textrm{ cm}\), then tomorrow's predicted height is \(10 + 2 = 12 \textrm{ cm}\).
This is a mathematical model because it uses numbers and relationships. It is simple, but it can still be useful.
Here is another example. Suppose a ramp test shows that a toy car rolls farther when the ramp is higher. If a car travels \(40 \textrm{ cm}\) from one height and \(60 \textrm{ cm}\) from a greater height, students may predict that an even higher ramp will make the car travel farther, if other conditions stay the same.
Example: Using data to make a prediction
A bean plant has heights of \(4 \textrm{ cm}\), \(6 \textrm{ cm}\), \(8 \textrm{ cm}\), and \(10 \textrm{ cm}\) over four days.
Step 1: Look for a pattern.
The height increases by \(2 \textrm{ cm}\) each day because \(6 - 4 = 2\), \(8 - 6 = 2\), and \(10 - 8 = 2\).
Step 2: Extend the pattern.
If the pattern continues, the next height is \(10 + 2 = 12 \textrm{ cm}\).
Step 3: State the prediction.
The model predicts the plant will be \(12 \textrm{ cm}\) tall on the next day.
This prediction is useful, but it depends on the assumption that the same pattern continues.
Predictions can be short-term or long-term. A short-term model may predict tomorrow's temperature. A long-term model may predict how a population in an ecosystem could change over many years. Long-term predictions are often harder because more variables can change.
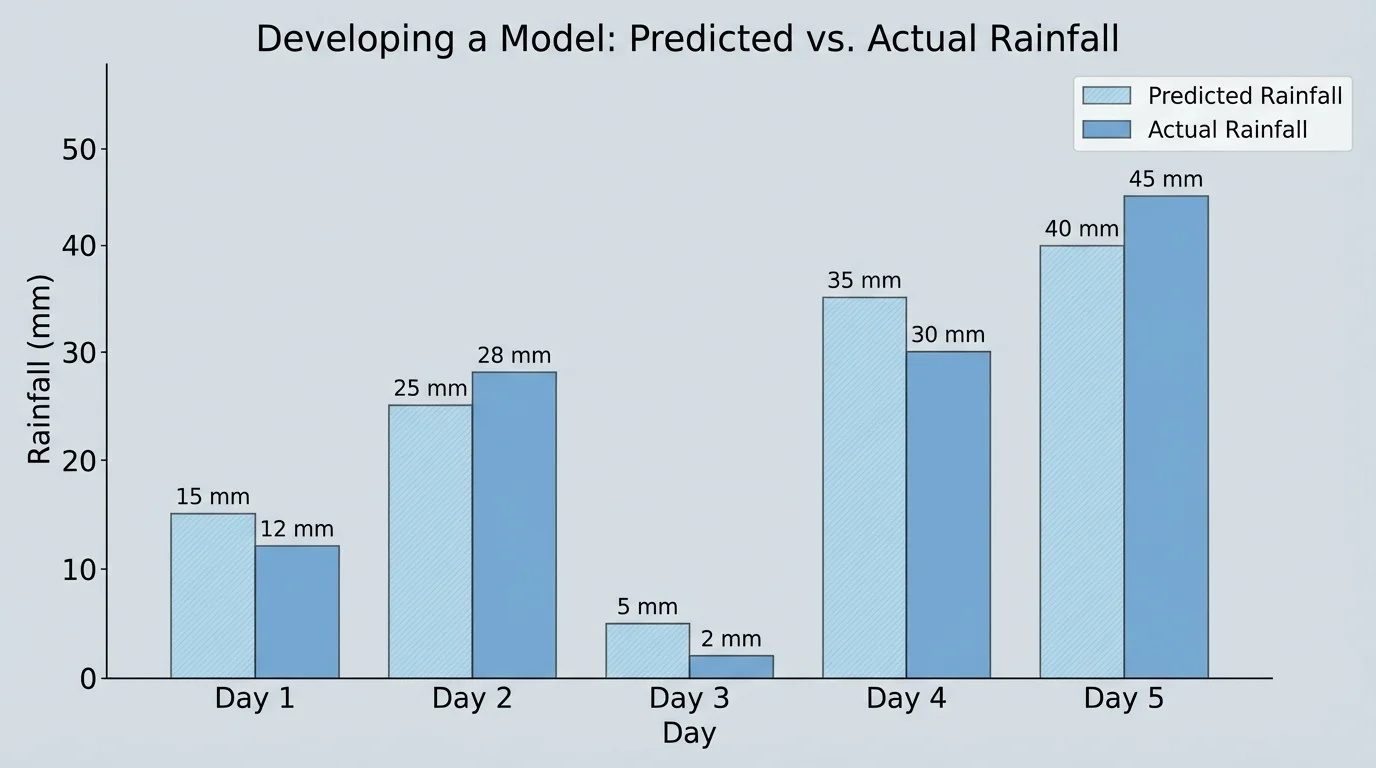
[Figure 4] A model is not finished just because it looks neat. Scientists check it against evidence. If a rainfall model predicts rain on five days but the real weather matches only two days well, the model needs improvement.
Testing means comparing the model's output with what really happened. If the plant model predicts \(12 \textrm{ cm}\) and the real plant reaches only \(11 \textrm{ cm}\), the difference is \(12 - 11 = 1 \textrm{ cm}\). That does not always mean the model is useless. It may mean the model is close, or that one assumption was wrong.
Scientists then ask questions such as: Were all important variables included? Was the data measured carefully? Did the system change in an unexpected way? Should the model be more detailed, or would a simpler model actually work better?
For example, if the plant-growth model ignored temperature, students may add temperature as a new variable. If one plant got less light because it stood in a shadow, the model may need revision. When a model improves, its predictions often become more accurate.
Patterns help us make reasonable guesses, but science asks for more than guessing. A scientific model uses observations and evidence, then gets tested and revised.
Later, when students compare graph predictions with real measurements, the same idea from [Figure 3] still matters: a trend line is helpful only if the future continues to behave like the past. If the pattern changes, the prediction changes too.
The same phenomenon can be modeled in different ways. Think about weather. A map with cloud symbols describes where storms are. A graph of temperature over time shows a changing pattern. A computer simulation can combine air pressure, wind, and humidity. Each model has a different strength.
This is true in many fields. To study how a bridge holds weight, an engineer may use a drawing to show shape, a physical model to test materials, and a computer model to estimate forces. None of these models alone tells the whole story, but together they build stronger understanding.
Choosing the best model depends on the question. If the question is "What parts are connected?" then a diagram may work best. If the question is "What value comes next?" then a graph or a mathematical rule may be more useful. If the question is "What happens if we change one part?" then a computer simulation may help most.
| Type of model | Best for | Example |
|---|---|---|
| Physical model | Showing shape or motion | Ball-and-flashlight Moon model |
| Diagram model | Showing parts and connections | Water cycle diagram |
| Graph model | Showing patterns in data | Plant height over days |
| Mathematical model | Calculating and predicting | \(\textrm{Height tomorrow} = \textrm{height today} + \textrm{daily growth}\) |
| Computer model | Handling many variables | Weather forecast model |
Table 2. Different model types and the jobs they do best.
Models matter far beyond the classroom. Meteorologists use models to predict storms. Doctors use models to track how illness may spread in a community. Environmental scientists use models to study pollution in rivers and oceans. Architects and engineers use models to test buildings before construction begins.
Sports also use models. A basketball player may think about angle and force when shooting. Coaches look at patterns in player movement and scoring. A simple model can help predict which strategy might work best against another team.
Farmers use models to decide when to plant crops. They may look at rainfall patterns, soil moisture, and temperature. If a weather model predicts a frost, farmers can protect sensitive plants. These decisions show how models help people act before something happens.
Why models are so powerful
Models connect observation, explanation, and prediction. They help us take information from the world, organize it, and then use it to answer questions. A model is like a thinking tool: it helps the mind handle systems that are too large, too hidden, or too complicated to understand all at once.
Even video games use models. The game may include a model of motion, weather, or energy use so that the world behaves in believable ways. Although games are for entertainment, the idea is similar: rules are built to represent how something works.
Because models are simplified, they can be useful and limited at the same time. A model may work well in one situation and poorly in another. A plant-growth model based on one classroom may not work exactly the same in a different climate.
People must also be careful not to trust a model more than the evidence. If a computer model gives a prediction, that prediction should still be checked. Better data usually leads to better models. Poor data often leads to weak predictions.
Fairness matters too. If a model leaves out important information, it may give misleading results. That is why scientists explain their assumptions and limitations clearly. A strong model is not one that claims to know everything. It is one that matches evidence, makes useful predictions, and is open to improvement.
When you develop a model, you are doing real scientific thinking. You are looking for patterns, deciding what matters, testing ideas, and revising your understanding. That process is one of the clearest ways science helps people explain the world and prepare for what may come next.