Why does the price of a used game console suddenly jump when stores run out? Why do strawberries cost more in winter than in summer? Why can a simple smartphone contain materials, labor, and technology from many parts of the world, yet still appear on a shelf at a price people are willing to pay? These questions all connect to one powerful idea in economics: markets help decide how scarce resources are used.
Scarcity means that people have limited resources but unlimited wants. There is not enough time, money, labor, land, machinery, and raw materials to produce everything everyone might want. Because resources are scarce, every society must answer basic economic questions: What should be produced? How should it be produced? For whom should it be produced?
In a market economy, many of these decisions are not made by a single central planner. Instead, they emerge from countless choices by buyers and sellers. A bakery decides how many loaves to make. Shoppers decide whether the bread is worth the price. Farmers choose whether to grow wheat or corn. Trucking companies decide where to deliver. These separate decisions connect through prices.
Scarcity is the condition that results when unlimited wants exceed limited resources.
Competitive market is a market with many buyers and sellers, similar products, and relatively free entry and exit, so no single participant has much control over price.
Allocation of resources means deciding how land, labor, capital, and entrepreneurship are used to produce goods and services.
Competitive markets are important because they create signals. If more people want electric bikes, prices and profits may rise. That gives firms a reason to produce more and gives resource owners a reason to move labor, materials, and investment toward that industry. In this way, markets do more than set prices; they guide resources.
At the center of market analysis are two forces: demand and supply. Demand refers to how much of a good or service consumers are willing and able to buy at different prices. Supply refers to how much producers are willing and able to sell at different prices.
There is an important difference between a whole curve and a single point on that curve. Quantity demanded is the amount buyers want at a specific price. Quantity supplied is the amount sellers offer at a specific price. Economists usually say that when price rises, quantity demanded falls, while quantity supplied rises, all else equal.
This pattern makes sense. If the price of movie tickets rises from $10 to $18, some people decide to stream at home instead. But for theaters, the higher price makes each ticket more valuable, so selling more tickets becomes more attractive. Price acts like information and incentive at the same time.
How prices coordinate decisions
A price is not just a number on a tag. It tells consumers how scarce a good is relative to how much people want it, and it tells producers whether making more of that good is worthwhile. In a competitive market, no one has to know the entire economy. Buyers respond to what they see in stores and online, and sellers respond to revenue and costs. The price system helps coordinate these separate decisions.
Demand can be influenced by income, preferences, population, expectations, and the prices of related goods. Supply can be influenced by production costs, technology, taxes, natural conditions, and the number of sellers. These factors matter because markets are always changing.
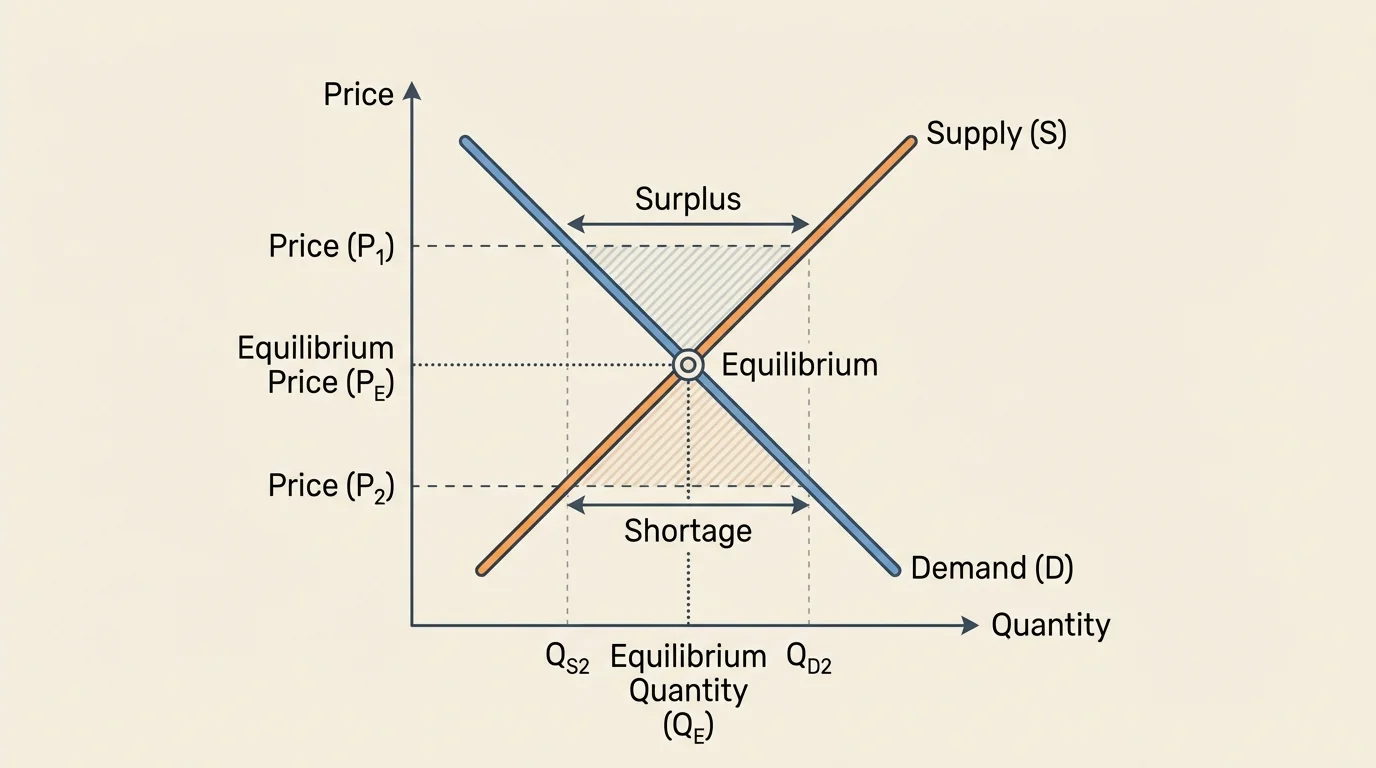
[Figure 1] Economists often show market behavior with curves. The equilibrium point is where the quantity demanded equals the quantity supplied. At that price, the plans of buyers and sellers match: the amount consumers want to buy is exactly the amount firms want to sell.
If the market price is above equilibrium, sellers offer more than buyers want. This creates a surplus. Unsold goods build up, and sellers usually respond by lowering price. If the market price is below equilibrium, buyers want more than sellers offer. This creates a shortage. Consumers compete to buy limited goods, and sellers usually respond by raising price.
This process is sometimes called the market's self-correcting mechanism. No central authority has to tell every store what to charge every minute. Instead, shortages and surpluses create pressure that pushes price toward equilibrium. That is why market prices often change quickly after a sudden event, such as bad weather reducing crop harvests or a viral trend increasing demand for a product.
Suppose a sneaker company releases a limited-edition model. If the retail price is set too low, the shoes sell out immediately, lines form, and resale prices jump. That shortage signals that the original price was below the market-clearing price. If the company had produced too many pairs at too high a price, unsold inventory would pile up, signaling surplus.
The graph in [Figure 1] also helps explain why equilibrium is so important. It is not "perfect" in a moral sense, but it is the point where market pressure to change price is weakest because planned buying and planned selling already match.
When economists say a competitive market is allocatively efficient, they mean resources are directed toward producing the goods and services people value most, based on their willingness and ability to pay. In a competitive setting, firms that satisfy consumer demand at lower cost are rewarded with sales and profit, while firms that waste resources are pressured to improve or leave the market.
Efficiency here does not mean "everyone gets everything they want." It means scarce resources are used in a way that maximizes the total gains from voluntary trade. If a student is willing to pay $4 for a bottle of water and a store is willing to sell it for $2, a trade at $3 makes both sides better off. Multiply that basic logic across millions of transactions, and markets channel goods toward buyers who value them and production toward sellers who can provide them.
Why competition matters
Competition limits the power of any one firm to charge whatever it wants. Because consumers can switch to rivals, firms must pay attention to quality, price, and cost. That pressure encourages innovation, reduces waste, and helps resources move toward producers who use them well.
Competitive markets also create incentives for specialization. A farmer grows crops rather than making phones. A software engineer writes code rather than raising cattle. Through exchange, people and firms focus on what they do relatively well, and markets connect their output to others who need it. This increases total production from limited resources.
Still, efficiency depends on certain conditions. Buyers and sellers need useful information. Property rights must be protected. There must be enough competition so no single firm can dominate the market. Those conditions are more likely in some markets than others.
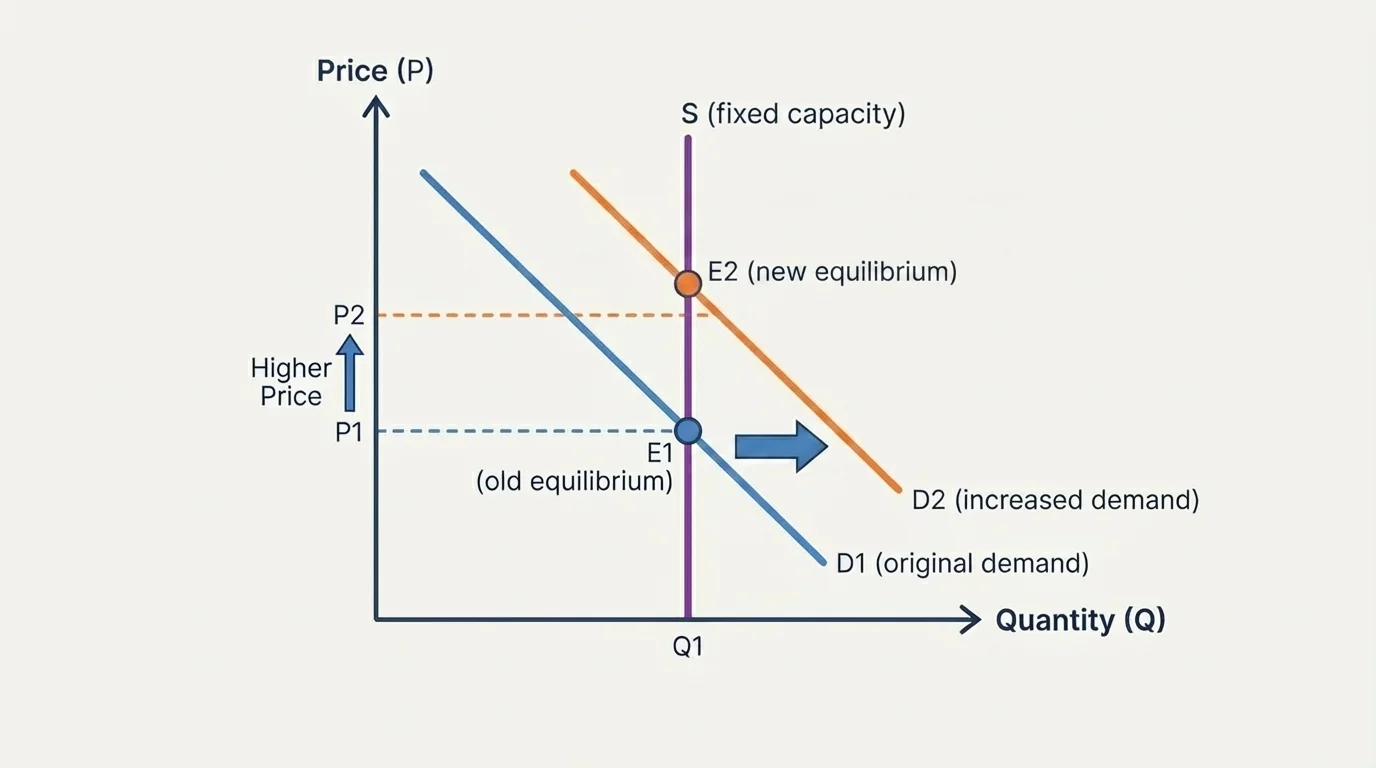
[Figure 2] Not every market change comes from movement along the same curve. Sometimes the entire curve shifts, and that changes the whole market situation, as stronger consumer interest illustrates. Distinguishing between a movement along a curve and a shift of the curve is one of the most important skills in economics.
A movement along the demand curve happens when the good's own price changes. A shift of the demand curve happens when some other factor changes, such as income, trends, expectations, or the price of related goods. For example, if a singer suddenly becomes far more popular, demand for concert tickets may rise at every price. The entire demand curve shifts right.
Supply works the same way. A movement along the supply curve happens when price changes. A shift of the supply curve happens when production conditions change. If the cost of microchips falls, laptop producers can supply more laptops at every price. Supply shifts right. If a drought harms orange harvests, the supply of oranges shifts left.
These shifts explain many real events. A new fitness trend can increase demand for protein drinks. A technological breakthrough can increase supply of solar panels. A tax on cigarettes can reduce supply by raising production costs. Expectations matter too: if people expect gas prices to rise next week, some buy more today, raising current demand.
| Market change | What happens | Likely result |
|---|---|---|
| Demand increases | Demand curve shifts right | Price rises, quantity rises |
| Demand decreases | Demand curve shifts left | Price falls, quantity falls |
| Supply increases | Supply curve shifts right | Price falls, quantity rises |
| Supply decreases | Supply curve shifts left | Price rises, quantity falls |
Table 1. Common effects of supply and demand shifts on equilibrium price and quantity.
Notice that some events affect both curves at once. For example, a new health report about coffee could reduce demand, while improved farming methods increase supply. In such cases, economists can usually predict the direction of one outcome more confidently than the other. Price might clearly fall, while the change in quantity is uncertain until more data are known.
Supply and demand analysis becomes clearer when we use numbers. These examples show how market logic can be translated into simple calculations.
Example 1: Finding equilibrium from equations
Suppose demand is given by
\[Q_d = 100 - 2P\]
and supply is given by
\[Q_s = 20 + 2P\]
Step 1: Set quantity demanded equal to quantity supplied.
At equilibrium, quantity demanded equals quantity supplied, so solve \(Q_d = Q_s\):
\[100 - 2P = 20 + 2P\]
Step 2: Solve for price.
Add \(2P\) to both sides and subtract \(20\):
\(80 = 4P\)
So \(P = 20\).
Step 3: Find equilibrium quantity.
Substitute \(P = 20\) into either equation:
\[Q = 100 - 2(20) = 60\]
The equilibrium is price = $20 and quantity = 60.
This result means that at $20, consumers want exactly 60 units and producers want to sell exactly 60 units. There is no built-in pressure for price to rise or fall.
Example 2: Identifying a shortage
Suppose the government or a store policy sets price at $15 in the same market.
Step 1: Calculate quantity demanded.
\[Q_d = 100 - 2(15) = 70\]
Step 2: Calculate quantity supplied.
\[Q_s = 20 + 2(15) = 50\]
Step 3: Compare the two quantities.
Buyers want \(70\) units, but sellers offer only \(50\). The shortage is
\[70 - 50 = 20\]
At $15, the market experiences a shortage of 20 units.
A shortage like this often leads to waiting lines, empty shelves, or resale at higher prices. The shortage itself is evidence that the price is below equilibrium.
Example 3: Effect of increased demand
Suppose demand rises because a product becomes trendy. The new demand equation is
\[Q_d = 120 - 2P\]
Supply stays the same:
\[Q_s = 20 + 2P\]
Step 1: Set the new demand equal to supply.
\[120 - 2P = 20 + 2P\]
Step 2: Solve for the new price.
\(100 = 4P\)
So \(P = 25\).
Step 3: Find the new quantity.
\[Q = 20 + 2(25) = 70\]
The new equilibrium is price = $25 and quantity = 70. Compared with the earlier equilibrium, both price and quantity increase.
These simple calculations show the same logic as the graphs. Whether economists use words, diagrams, or equations, the key idea is the same: markets move toward the price where intended buying and intended selling match.
Competitive markets can allocate resources efficiently, but not always. One problem is an externality, which happens when a cost or benefit affects people who are not directly part of the transaction. If a factory pollutes a river, the market price of its product may not include the full social cost. The product may be overproduced because the harm is pushed onto others.
Another issue is a public good, such as national defense or street lighting. Public goods are difficult to provide through ordinary market exchange because people can benefit even if they do not pay. This creates a free-rider problem, which can lead private markets to underprovide the good.
Markets can also be less efficient when firms have too much market power. In a monopoly, one seller can restrict output and raise prices above competitive levels. Information problems matter too. If consumers cannot tell whether a used car is reliable, the market may not reward quality properly. Finally, a market can be efficient in the economic sense yet still raise concerns about fairness. A life-saving medicine might go to those who can pay most, not necessarily those who need it most.
Ticket resale markets often reveal shortages instantly. When a concert officially sells out in minutes but resale prices climb sharply, the original price was likely below the market-clearing price.
These limitations help explain why real economies are usually mixed economies. They rely heavily on markets, but governments also set rules, provide public goods, address market failures, and sometimes redistribute income.
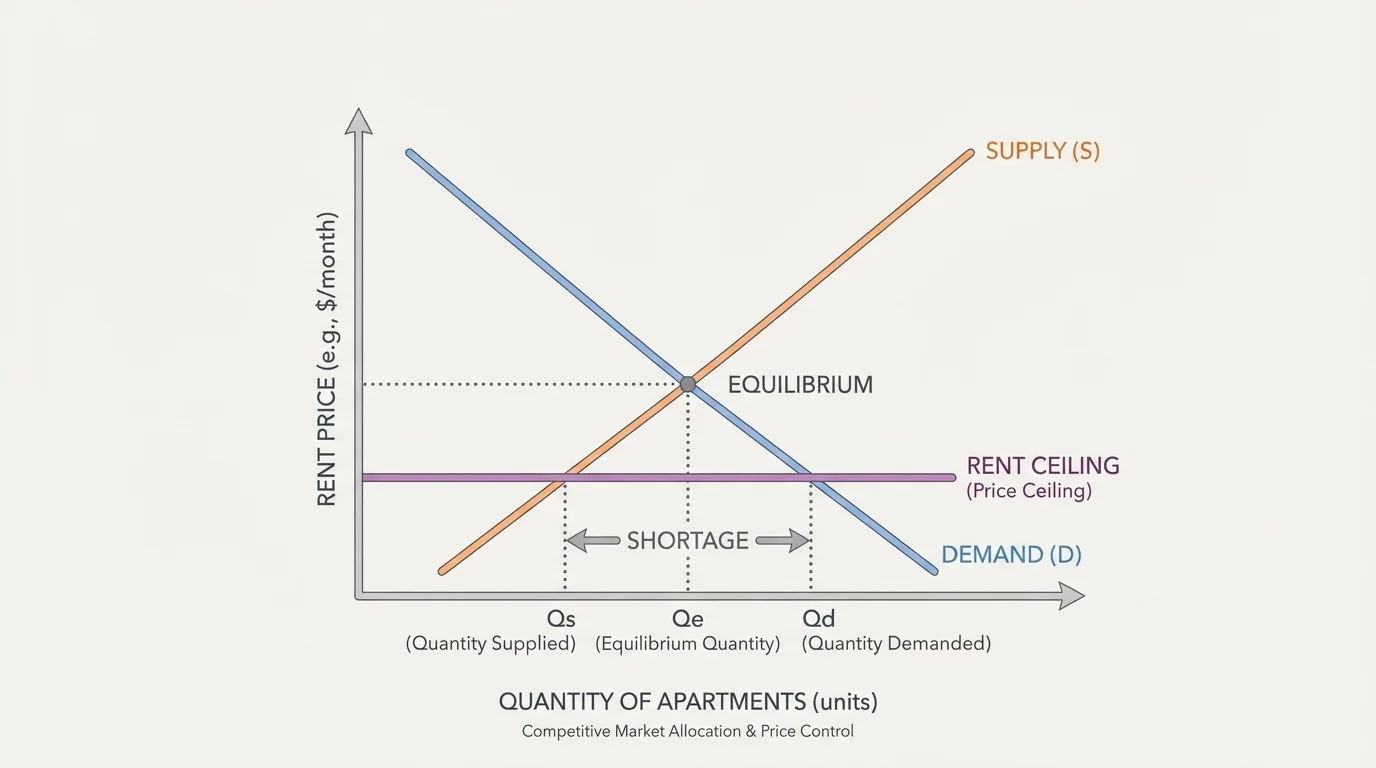
[Figure 3] In a mixed economy, markets do much of the allocation work, but government policies can push outcomes away from or closer to efficiency. A policy can improve a market if it corrects a failure, but it can also create unintended consequences if it interferes with price signals too much. When government holds price below equilibrium, shortages often result.
A price ceiling is a legal maximum price. Rent control is a common example. If the ceiling is below equilibrium rent, more people want apartments than landlords want to supply at that price. That creates a shortage. Some tenants benefit from lower rent, but apartment scarcity may increase waiting lists, reduce maintenance, or encourage informal side payments.
A price floor is a legal minimum price. Minimum wage laws and agricultural support prices are examples. If the floor is above equilibrium, quantity supplied can exceed quantity demanded, creating a surplus. For labor, that may appear as unemployment if more people want jobs at the legal wage than employers want to hire.
Taxes and subsidies also shift supply or demand. A tax on gasoline raises sellers' costs or buyers' costs, reducing the quantity traded and changing the final price paid and received. A subsidy for solar energy lowers effective costs and encourages more production or consumption. Unlike a random price control, these policies are sometimes used to address externalities. For example, a tax on cigarettes aims to reduce overconsumption linked to health costs.
Later, the same shortage logic shown in [Figure 3] helps explain why capped prices can produce side effects beyond lower prices alone. If demand remains high while supply weakens, non-price rationing appears through lines, favoritism, or reduced quality.
Government can also support competition through antitrust laws, consumer protection rules, property-rights enforcement, and transparent information requirements. These actions do not replace the market; they can make the market work better.
Consumers and producers are not passive parts of the system. Their decisions shape every market outcome. Consumers express preferences through purchases. If enough buyers switch from sugary drinks to water, demand shifts. If shoppers start valuing environmentally friendly products, firms notice. Consumer sovereignty means that, in many markets, producers succeed by responding to what buyers want.
Producers, however, do not simply obey consumers. They innovate, advertise, lower costs, and introduce new goods. Before smartphones existed, consumers were not demanding app ecosystems in the modern sense. Producers often reshape demand by creating products people did not know they wanted. Still, if those products fail to attract enough buyers at profitable prices, resources will eventually move elsewhere.
Labor is also part of market allocation. Wages signal where workers are most valued. If hospitals urgently need nurses, wages may rise, encouraging more people to train for that field. If a certain skill becomes less useful because of automation, wages may fall, pushing workers to retrain. This is resource allocation in human form.
Because every choice has an opportunity cost, producers and consumers constantly compare alternatives. A farmer who plants soybeans gives up the chance to plant wheat. A student who spends money on concert tickets gives up the chance to spend that money elsewhere. Prices help people make those trade-offs in a decentralized way.
Earlier economic ideas still matter here: incentives influence behavior, choices involve trade-offs, and opportunity cost measures the value of the next best alternative given up. Supply and demand analysis builds directly on those ideas.
In the end, competitive markets are powerful because they link scarcity, incentives, and choice. They direct resources toward goods and services people demand, encourage producers to control costs, and adjust through changes in price when conditions change. But their efficiency is not automatic in every case. Real-world economies depend on both market signals and carefully designed rules.