A streaming app recommends one song after another, a calculator turns a number into an answer, and a video game turns every move into a result. In each case, there is a rule: something is entered, and something is produced. Mathematics studies this idea very carefully, and one of its most important tools is the function. A function helps us describe patterns, make predictions, and connect numbers to the real world.
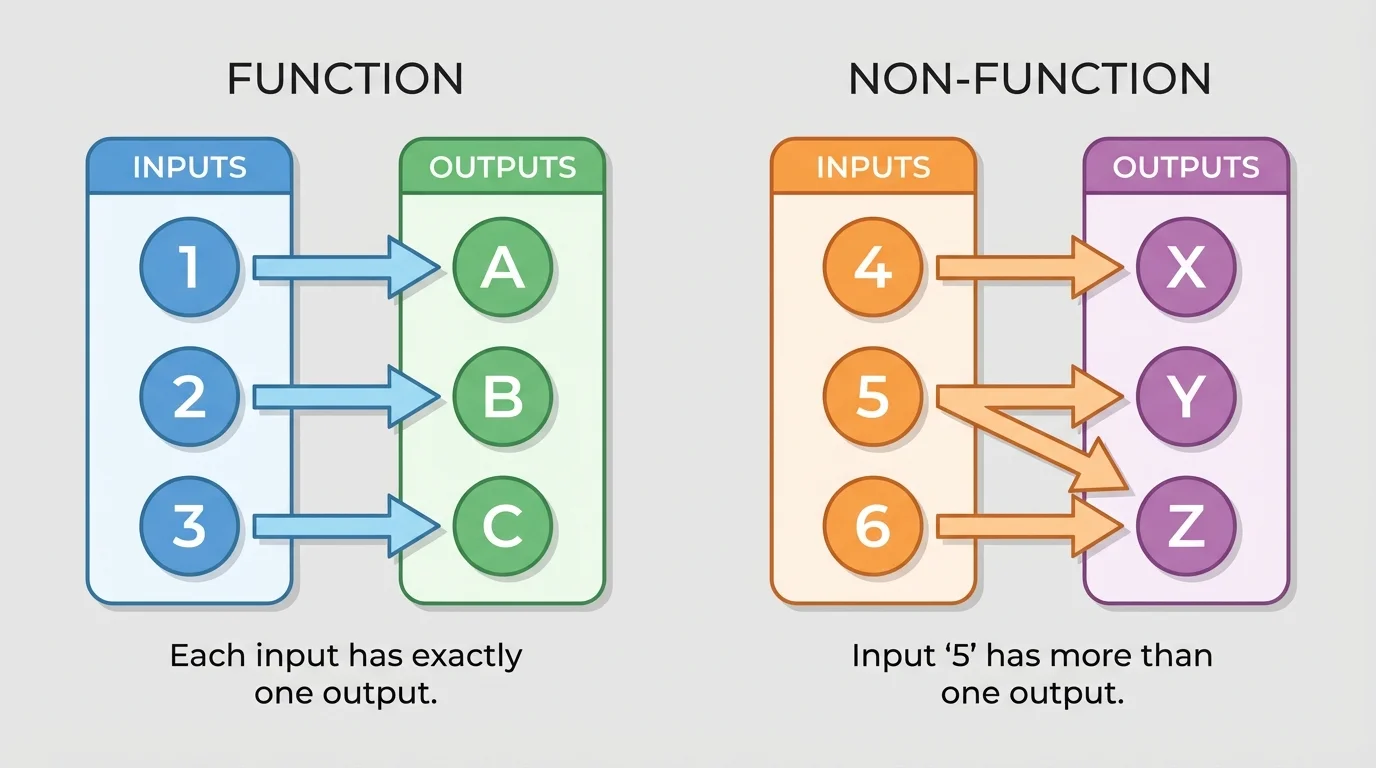
A function is a rule that assigns to each input exactly one output. That phrase exactly one is the key idea, and [Figure 1] illustrates this clearly with mapping diagrams. If you choose one input, the rule must give only one output. The output might be a number, a point, or another quantity, but there cannot be two different outputs for the same input.
For example, suppose a rule says, "Multiply the input by \(2\)." If the input is \(4\), the output is \(8\). If the input is \(-3\), the output is \(-6\). Each input matches exactly one result, so this rule is a function.
A function is a rule that assigns to each input exactly one output.
Input is the value you put into the rule.
Output is the value the rule gives back.
A relation is any set of ordered pairs. A function is a special kind of relation.
Now consider a different rule: "If the input is \(5\), the output could be \(2\) or \(9\)." That is not a function, because one input, \(5\), has two different outputs. A function must be consistent.
It is important to notice something subtle: different inputs can give the same output. For example, in the rule \(y = x^2\), the inputs \(2\) and \(-2\) both produce \(4\). That is still a function because each input has only one output. The problem happens only when one input has more than one output.
We often record a function using ordered pairs. An ordered pair has the form \((x, y)\), where \(x\) is the input and \(y\) is the corresponding output. The order matters. The pair \((3, 7)\) means input \(3\), output \(7\). It is not the same as \((7, 3)\).
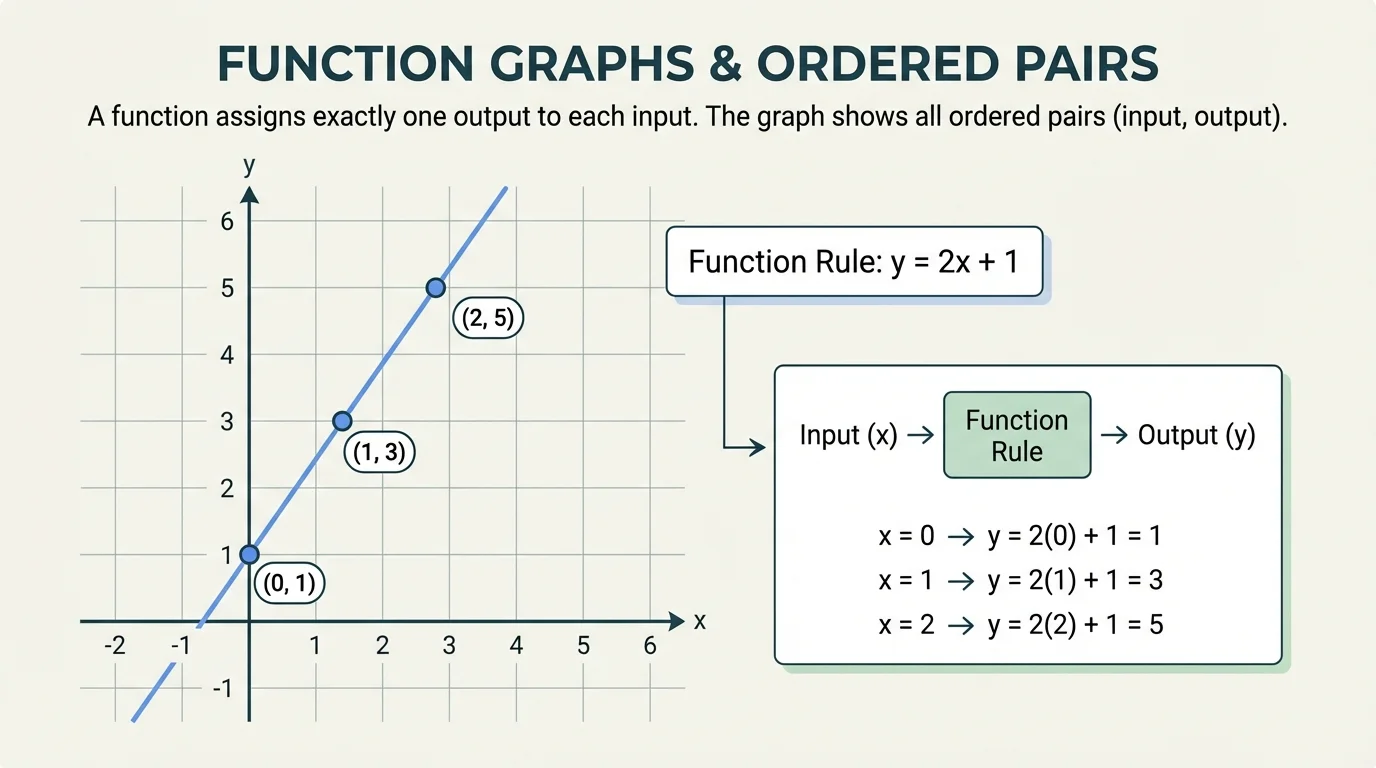
If a function follows the rule \(y = 2x + 1\), then some ordered pairs are \((0, 1)\), \((1, 3)\), \((2, 5)\), and \((-1, -1)\). Each pair shows one input and the output produced by the rule.
On the coordinate plane, the first number in \((x, y)\) tells how far to move left or right, and the second number tells how far to move up or down.
A table is another common way to represent a function. In a function table, the first column usually lists inputs, and the second column lists outputs. If any input appears more than once with different outputs, the relation is not a function.
| Input \(x\) | Output \(y\) |
|---|---|
| \(0\) | \(1\) |
| \(1\) | \(3\) |
| \(2\) | \(5\) |
| \(3\) | \(7\) |
Table 1. A table of values for the function \(y = 2x + 1\).
This table represents a function because each input appears once and has one output. From the pattern, you may notice that the output increases by \(2\) whenever the input increases by \(1\).
[Figure 2] A graph of a function is the set of ordered pairs consisting of each input and its corresponding output. On a coordinate plane, each ordered pair becomes one point and shows how those points represent the rule visually. So a graph is not just a picture; it is a visual collection of all the input-output pairs in the function.
For the function \(y = 2x + 1\), the ordered pair \((2, 5)\) means that when the input is \(2\), the output is \(5\). On the graph, that appears as a point located \(2\) units to the right and \(5\) units up from the origin.
If we plot many ordered pairs from a function, we begin to see a shape. Some functions form a straight line, some form curves, and some create separate points only. No matter what the graph looks like, every point on the graph must match the rule of the function.
Suppose a point \((4, 9)\) lies on the graph of a function. That tells us something precise: the function assigns the output \(9\) to the input \(4\). Reading a graph means translating points back into input-output language.
Why a graph matters
A graph lets you see all the ordered pairs at once. Instead of checking one input at a time, you can notice patterns such as whether outputs increase, decrease, or stay steady as inputs change. This makes graphs especially useful for comparing functions.
Later, when you compare functions in tables, equations, and graphs, remember that they all describe the same kind of object: a set of input-output pairs.
A function can be represented in several forms. You might see it as words, a table, an equation, a graph, or a mapping diagram. Each form highlights something useful.
For example, the statement "the output is three more than the input" can be written as the equation \(y = x + 3\). It can also be shown in a table or on a graph. These are not different functions; they are different ways to describe the same function.
| Representation | Example | What it helps you see |
|---|---|---|
| Words | "Multiply by \(2\), then add \(1\)" | The rule in everyday language |
| Equation | \(y = 2x + 1\) | A precise algebraic rule |
| Table | Pairs like \((0,1)\), \((1,3)\) | Specific input-output values |
| Graph | Points on the coordinate plane | The overall pattern visually |
| Mapping | Arrows from inputs to outputs | Whether each input has one output |
Table 2. Common ways to represent the same function idea.
Skilled mathematicians move between these forms. If you can read one form and connect it to another, your understanding becomes much stronger.
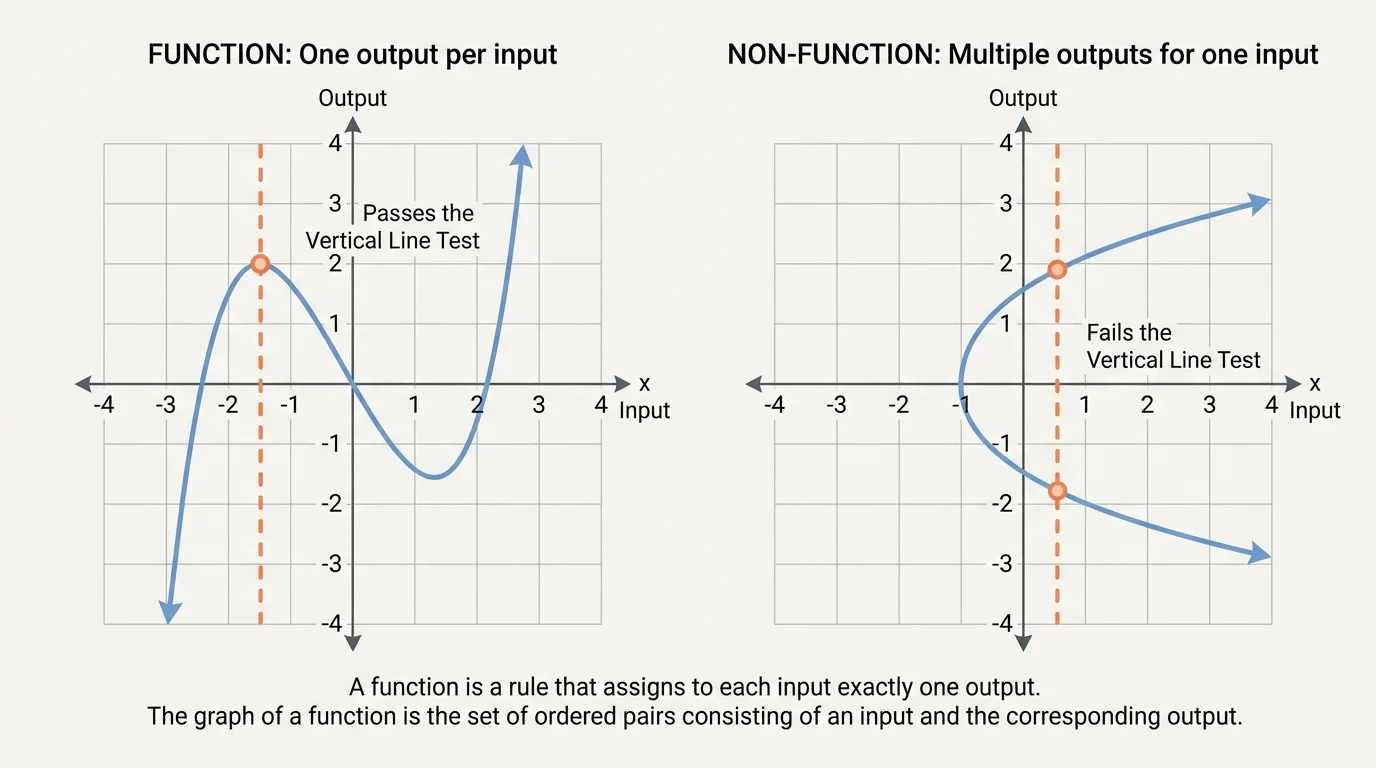
Not every relation is a function. A relation is any set of ordered pairs, but to be a function, each input must appear with only one output. On graphs, [Figure 3] helps check this idea with the vertical line test: if a vertical line hits the graph in more than one point, then one input has more than one output, so the relation is not a function.
Consider the relation \((1, 4)\), \((2, 5)\), \((1, 6)\). The input \(1\) is matched with both \(4\) and \(6\). Since one input has two outputs, this relation is not a function.
On the other hand, the relation \((1, 4)\), \((2, 4)\), \((3, 4)\) is a function. Several inputs share the same output, but no single input has more than one output.
Solved example 1: Is this relation a function?
Determine whether the relation \((2, 7)\), \((3, 9)\), \((4, 11)\), \((2, 8)\) is a function.
Step 1: Look at the inputs.
The inputs are \(2\), \(3\), \(4\), and \(2\).
Step 2: Check whether any input repeats with a different output.
The input \(2\) appears twice: once with output \(7\) and once with output \(8\).
Step 3: Decide.
Because one input has two different outputs, the relation is not a function.
The relation is not a function.
This kind of check works whether the relation is written as points, shown in a table, or described by a mapping. The question stays the same: does each input have exactly one output?
To evaluate a function means to find the output for a given input. When a function is written as an equation, you evaluate it by substituting the input value into the rule.
If \(f(x) = 3x - 2\), then \(f(4)\) means the output when the input is \(4\). Substitute \(4\) for \(x\): \(f(4) = 3(4) - 2 = 12 - 2 = 10\).
Solved example 2: Evaluate a function rule
Given \(g(x) = x^2 + 1\), find \(g(-3)\).
Step 1: Substitute the input.
Replace \(x\) with \(-3\): \(g(-3) = (-3)^2 + 1\).
Step 2: Compute the square.
\((-3)^2 = 9\), so \(g(-3) = 9 + 1\).
Step 3: Simplify.
\(g(-3) = 10\).
The output is \(g(-3) = 10\).
Function notation such as \(f(x)\) or \(g(x)\) is a compact way to name a function. It does not mean multiplication. The expression \(f(5)\) means "the value of function \(f\) at input \(5\)."
Functions can be compared even when they are shown in different forms. One function may be given by a table and another by an equation. To compare them, look at what outputs they assign to inputs and how those outputs change.
Suppose Function A is given by the equation \(y = 2x + 1\). Function B is shown in a table:
| Input \(x\) | Output \(y\) |
|---|---|
| \(0\) | \(4\) |
| \(1\) | \(6\) |
| \(2\) | \(8\) |
| \(3\) | \(10\) |
Table 3. Output values for Function B.
For Function A, if \(x = 0\), then \(y = 1\). If \(x = 1\), then \(y = 3\). If \(x = 2\), then \(y = 5\). Both functions increase by \(2\) when the input increases by \(1\), but Function B always has outputs that are \(3\) greater than Function A for the same inputs.
Solved example 3: Compare two functions
Function C is defined by \(y = x + 5\). Function D has ordered pairs \((0, 2)\), \((1, 3)\), \((2, 4)\), \((3, 5)\). Which function gives the greater output when \(x = 2\)?
Step 1: Find Function C at \(x = 2\).
Substitute \(x = 2\): \(y = 2 + 5 = 7\).
Step 2: Find Function D at \(x = 2\).
From the ordered pair \((2, 4)\), the output is \(4\).
Step 3: Compare the outputs.
Since \(7 > 4\), Function C gives the greater output.
At input \(2\), Function C has the greater output.
Graphs make comparisons easier because you can often see which outputs are larger for the same inputs by looking at which point or line is higher.
Functions are everywhere because many situations follow a consistent rule. If a parking garage charges $3 per hour, then the total cost depends on the number of hours parked. The rule can be written as \(C = 3h\), where \(h\) is the number of hours and \(C\) is the cost. Each number of hours gives exactly one cost, so this is a function.
Another example comes from temperature conversion. If the Celsius temperature is \(C\), then the Fahrenheit temperature is \(F = \dfrac{9}{5}C + 32\). Every Celsius value matches one Fahrenheit value. That makes the rule a function.
Cell phone maps, music apps, and online shopping all use functions behind the scenes. They constantly convert inputs such as time, distance, clicks, or ratings into outputs such as routes, recommendations, or prices.
Distance can also be a function of time. If a cyclist rides at a constant speed of \(12\) miles per hour, then after \(t\) hours the distance is \(d = 12t\). The graph of this function would show all ordered pairs \((t, d)\), and each point would represent one possible time and its matching distance.
One common mistake is thinking that a relation is not a function whenever an output repeats. That is false. Repeating outputs are allowed. Repeating inputs with different outputs are not allowed.
Another mistake is forgetting what a graph point means. The point \((3, 8)\) is not just a location. It means the function assigns output \(8\) to input \(3\). On a graph, every point tells a story about the rule.
The vertical line test from [Figure 3] gives a quick graph check, but the main idea is still the same exact definition: each input must have exactly one output. The graph test works because a vertical line represents one fixed input value.
When you look at equations, tables, mappings, and graphs, try to connect them. They are all different windows into the same idea. A function is a dependable rule, and its graph is the complete set of ordered pairs made from the inputs and their matching outputs.