Have you ever noticed that you usually need a coat in winter but shorts in summer? That is not just luck. It happens because nature often changes in patterns. When something changes in a way that repeats, we can study it and make smart predictions about what may happen next. Scientists do this with weather, plants, animals, and many other parts of the world.
A pattern is something that happens again and again in a way we can notice. Some patterns happen every day, like the Sun rising in the morning. Some happen every year, like leaves changing color in fall. When we learn a pattern, we can make a prediction, which is a careful idea about what is likely to happen in the future based on evidence.
Pattern means a repeated way that something happens or changes. Prediction means a statement about what is likely to happen next, based on what we know. Season means one of the four parts of the year with typical weather conditions: winter, spring, summer, and fall.
Patterns do not mean that every day is exactly the same. A pattern shows what happens most of the time. For example, if your town is usually hotter in July than in January, that is a pattern. One cool day in July does not erase the pattern. It just means nature can still vary from day to day.
To find a pattern, we need to observe carefully and collect information. In science, this information is called data. Data can include numbers, words, pictures, or symbols. If a class records the temperature every day for a month, those temperatures are data. If students mark whether each day is sunny, cloudy, rainy, or snowy, that is also data.
Scientists and students often compare data over time. They ask questions like these: Is the temperature rising or falling? Are rainy days happening more often in one month than another? Are there changes that repeat each season? Looking closely at data helps us move from guessing to reasoning.
You may already know that weather can change from day to day. It might rain today and be sunny tomorrow. This lesson adds a new idea: even though daily weather changes, larger patterns can still appear when we look across many days or across whole seasons.
Patterns of change can be fast or slow. A fast pattern might be a temperature drop before a storm. A slow pattern might be the way winter slowly changes into spring. In both cases, the changes tell us something useful about what may happen next.
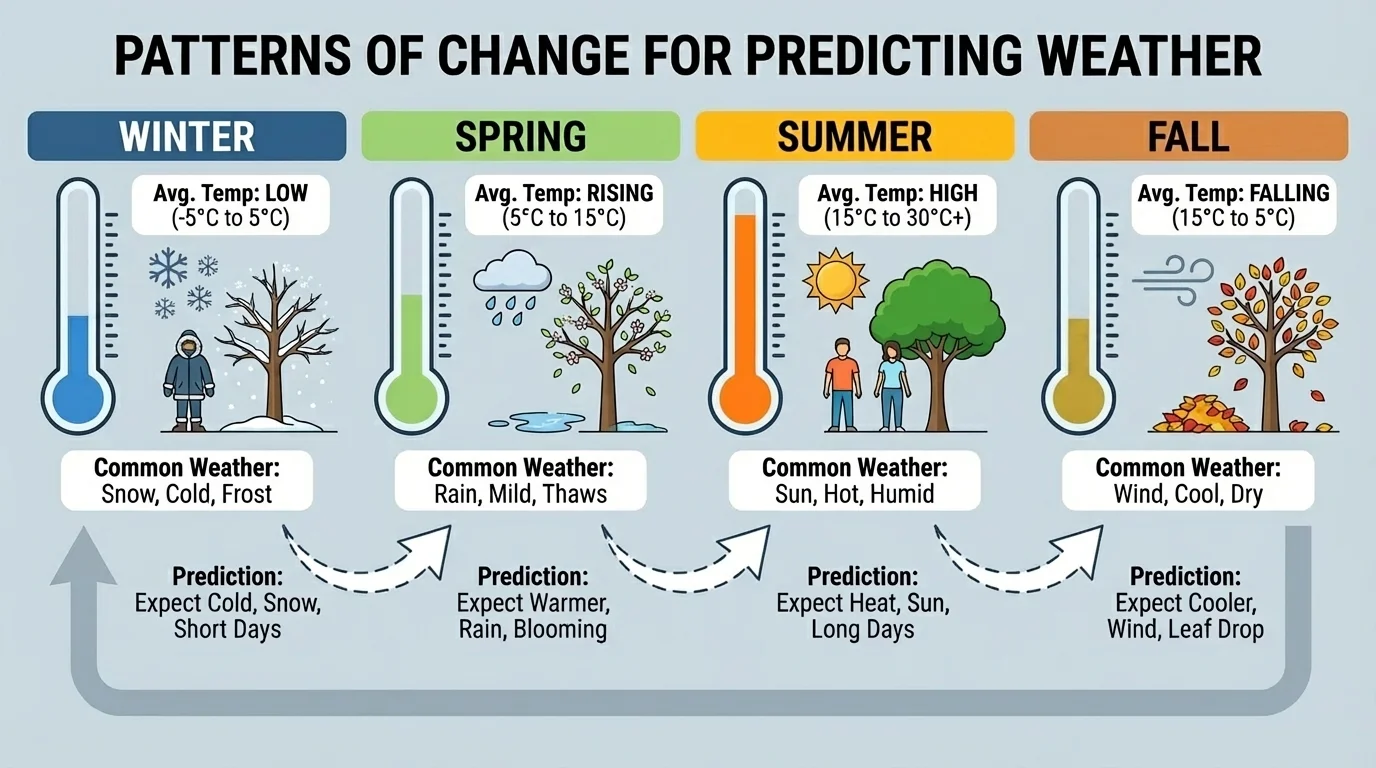
[Figure 1] Weather is one of the easiest places to spot repeated change. Over many years, seasons often bring similar kinds of weather. Winter is usually colder than summer. Spring often brings warming temperatures and more plant growth. Fall often becomes cooler again. These repeating changes help people prepare for what is coming.
Weather means the condition of the air outside at a certain time and place. Weather includes temperature, wind, clouds, rain, and snow. A season does not mean the weather is identical every day, but it does mean certain kinds of weather are more common during that part of the year.
For example, suppose a town records average temperatures through the year. The averages might look something like this: winter around \(5^\circ \textrm{C}\), spring around \(15^\circ \textrm{C}\), summer around \(28^\circ \textrm{C}\), and fall around \(16^\circ \textrm{C}\). Those numbers show a repeating yearly pattern. If summer has been the warmest season for many years, it makes sense to predict that the next summer will also be warmer than winter.
Weather patterns can also include rainfall. Some places have rainy seasons and dry seasons. If a place usually gets more rain in late spring than in late summer, people can use that pattern to decide when to plant crops, when to carry rain gear, or when rivers may rise.
Even a short set of observations can show a pattern. If a class tracks the weather for four weeks and notices that the temperature rises from about \(10^\circ \textrm{C}\) to \(18^\circ \textrm{C}\), they may predict that the next week will be warmer than the first week. This is not certain, but it is a reasonable prediction because it is based on a trend they observed.
Some animals seem to use weather patterns too. Birds may begin migration when the length of daylight and the temperature start changing in familiar seasonal ways.
Patterns can be local. One place may have snowy winters, while another place has rainy winters. That is why scientists collect data from the specific place they are studying. Good predictions come from good local evidence.
[Figure 2] When there is a lot of information, it can be hard to spot a pattern just by reading a long list. Tables and graphs make changes easier to notice. A table keeps information organized in rows and columns. A graph helps us see which values are greater, smaller, rising, or falling.
A table might list the days of a month and show each day's high temperature and weather type. A graph might use bars to show how many rainy days happened in each month. A line graph might show temperature changing across several days. These displays help our eyes quickly notice patterns.
| Month | Rainy Days | Average Temperature |
|---|---|---|
| March | \(8\) | \(12^\circ \textrm{C}\) |
| April | \(10\) | \(16^\circ \textrm{C}\) |
| May | \(11\) | \(20^\circ \textrm{C}\) |
| June | \(6\) | \(25^\circ \textrm{C}\) |
From this table, we can see two patterns. First, the average temperature rises from \(12^\circ \textrm{C}\) in March to \(25^\circ \textrm{C}\) in June. Second, rainy days increase from March to May and then drop in June. A student could predict that the next month after June might continue to be warm, and it may possibly have fewer rainy days than May had.
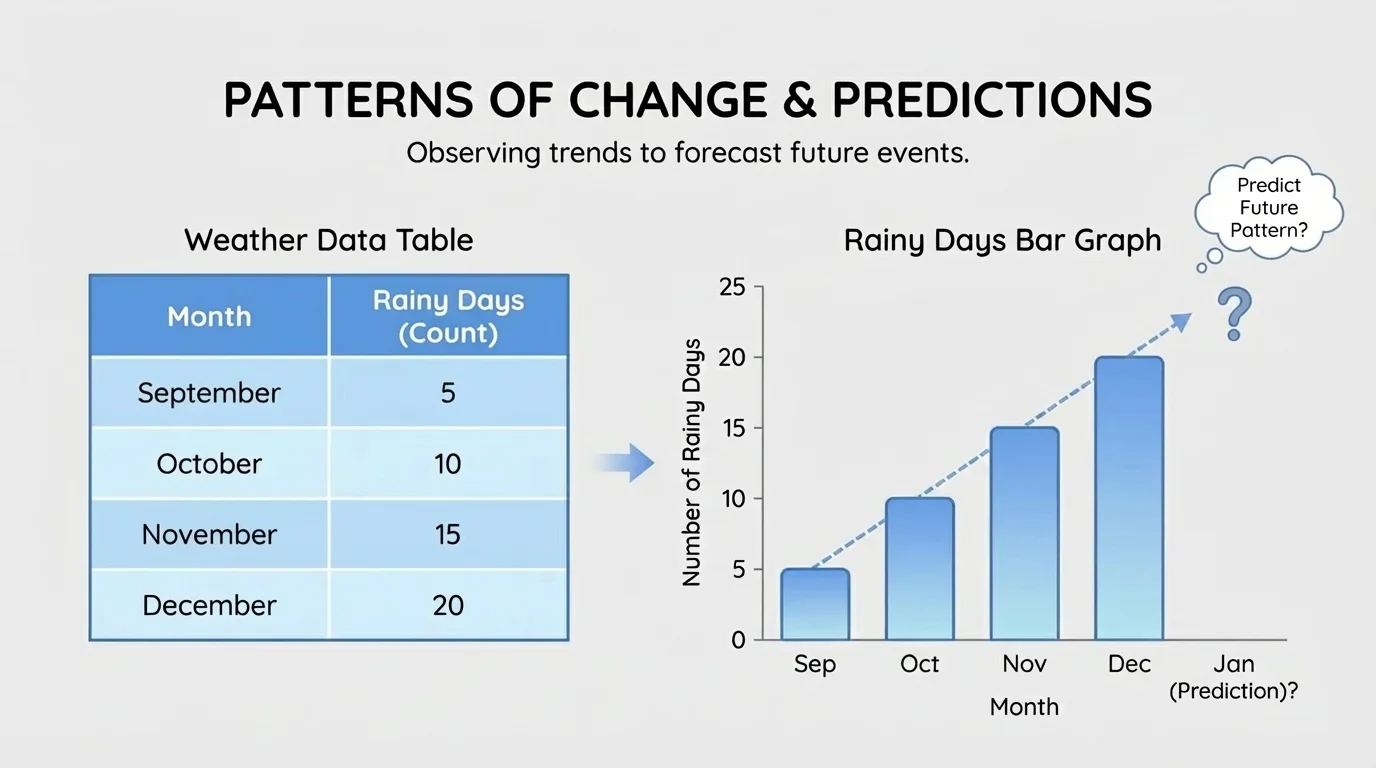
Graphs are especially useful when we want to make quick comparisons. A tall bar means a larger number. A shorter bar means a smaller number. If bars get taller month after month, we see an upward pattern. If they get shorter, we see a downward pattern.
Using data to make a prediction
A class records the afternoon temperature for five days: Monday \(18^\circ \textrm{C}\), Tuesday \(20^\circ \textrm{C}\), Wednesday \(21^\circ \textrm{C}\), Thursday \(23^\circ \textrm{C}\), Friday \(24^\circ \textrm{C}\).
Step 1: Look for change over time.
The temperatures are mostly increasing each day.
Step 2: Describe the pattern.
The pattern is a steady warming trend from \(18^\circ \textrm{C}\) to \(24^\circ \textrm{C}\).
Step 3: Make a prediction.
A reasonable prediction is that Saturday may be warmer than Friday, perhaps around \(25^\circ \textrm{C}\) or \(26^\circ \textrm{C}\).
This prediction is supported by the pattern, even though the exact temperature is not guaranteed.
Looking at displays of data is an important science skill. It helps us support our ideas with evidence instead of making random guesses.
A prediction should match the evidence. If the last several weeks have become warmer, it makes sense to predict warmer weather soon. If the data show that a certain month is usually the wettest, it makes sense to predict more rain during that month than during a drier month.
A good prediction often begins with words like these: "Based on the data..." or "The pattern suggests..." These phrases remind us that predictions come from observed evidence. They are not just opinions.
How predictions work
Scientists observe, record data, look for repeating change, and then use that pattern to predict what is likely to happen next. If new data do not match the prediction, scientists revise the prediction. This makes science flexible and evidence-based.
Suppose students track sunny days during one season. If they find that \(12\) out of \(15\) days were sunny, they might predict another sunny day soon. They would not say sunshine is certain, but they would say it is likely. The more data they collect, the stronger their prediction can become.
We can also compare seasons. If a place has had mild winters for many years and only a few snow days each winter, people may predict another mild winter. As we saw in [Figure 1], seasonal weather tends to repeat in broad ways, which is why predictions about seasons are often useful.
Predictions help people every day. Families check expected weather before choosing clothes. Schools plan field days during seasons that are usually mild. Farmers use rainfall and temperature patterns to decide when to plant. Builders may schedule outdoor work during drier times of year. Emergency workers watch changing weather patterns to prepare for storms.
Patterns of change are not only found in weather. They also appear in living things. A plant may sprout in spring, grow more in summer, change in fall, and rest in winter. These repeating changes can help us predict what the plant will do next.
[Figure 3] Life cycle is a useful idea here. A life cycle is the series of stages a living thing goes through as it grows and changes. Butterflies, frogs, and flowering plants all show patterns of change in their life cycles. If we know the stages, we can predict what stage may come next.
Trees are a clear example. In many places, trees grow new leaves in spring, provide lots of shade in summer, lose leaves in fall, and stand bare in winter. If you see tiny buds in early spring, you can predict that leaves will soon appear. That prediction is based on a pattern seen year after year.
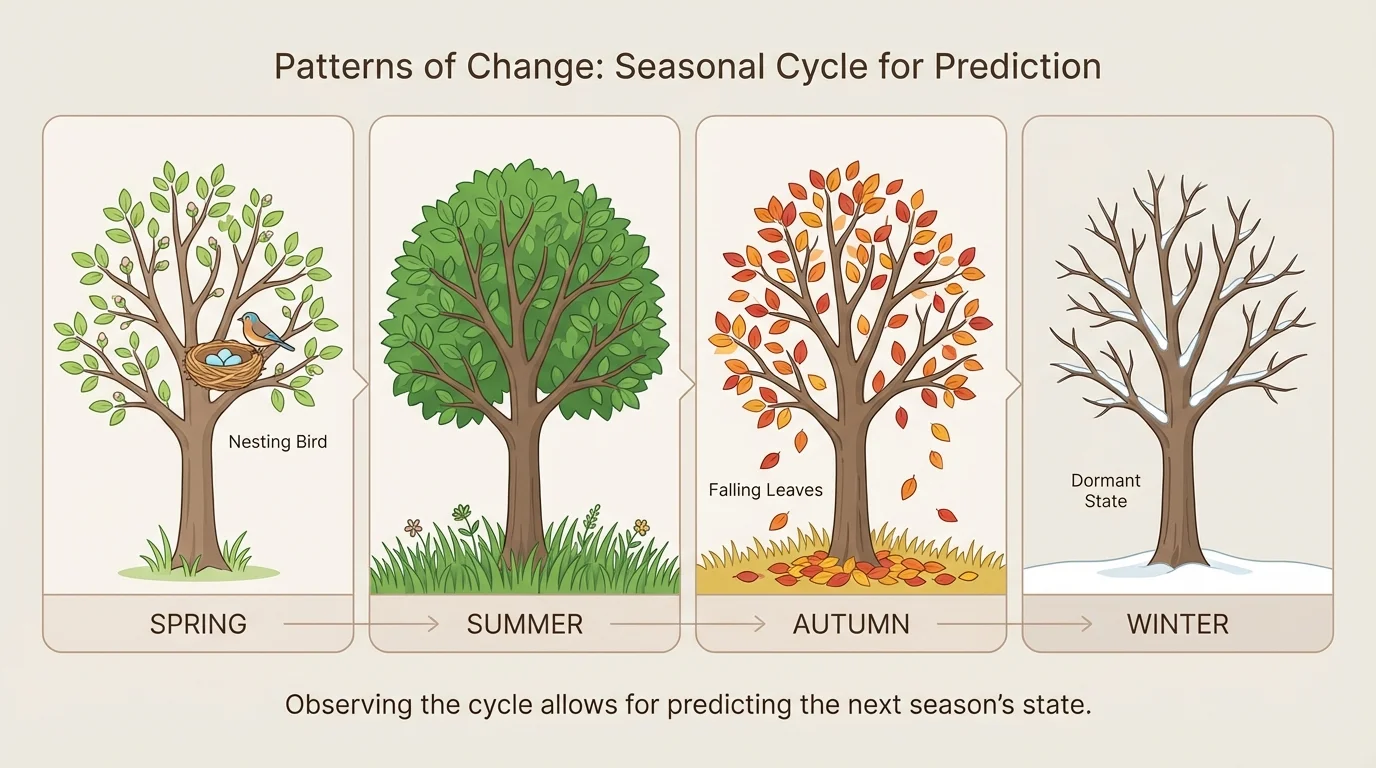
Animals also follow patterns. Some birds build nests in spring. Some squirrels gather more food in fall. Some animals are more active at certain times of year because temperature, food, and daylight change in familiar ways. These patterns help scientists understand and predict animal behavior.
Real-world example: school garden
Students in a school garden notice that bean plants sprout about \(7\) days after planting when the soil is warm and moist.
Step 1: Observe the pattern.
Each time the class plants beans in similar spring conditions, sprouts appear after about \(7\) days.
Step 2: Use the pattern.
If the class plants new bean seeds today in similar conditions, they can predict sprouts in about \(7\) days.
Step 3: Check the result.
Students compare the prediction with what actually happens and improve future predictions if needed.
This is the same scientific thinking used in weather studies: observe, find a pattern, and predict.
The same idea connects weather and living things. If spring temperatures are warming and daylight is lasting longer, many plants and animals begin their spring changes. The repeating pattern in the environment helps explain repeating patterns in life.
Predictions based on patterns are useful because they help people prepare. If we predict rain, we carry umbrellas. If we predict a hot afternoon, athletes bring extra water. If we predict a cold night, gardeners may cover sensitive plants.
Predictions also help communities. Farmers can use seasonal data to protect crops. City workers can prepare snowplows if winter storms are likely. Park rangers can warn visitors if weather patterns suggest heat, flooding, or storms. When people use evidence from patterns, they make safer and smarter choices.
Meteorologists, scientists who study weather, use huge amounts of data from thermometers, satellites, radar, and weather stations to find patterns and improve forecasts.
Even students can use pattern-based predictions. A class can predict the best time to observe shadows, the best season to plant certain seeds, or the most likely month for a school picnic with mild weather. Science becomes useful when observations lead to decisions.
Patterns are powerful, but they do not tell the future with complete certainty. Nature is complicated. A place that is usually dry in one month may still get an unexpected storm. A warm week in spring may be followed by a sudden cold day. This does not mean the pattern was wrong. It means patterns show what is likely, not what is guaranteed.
That is why scientists keep collecting new data. Fresh information can strengthen a prediction or show that conditions are changing. If a line graph suddenly drops instead of rising, the prediction may need to change too. Good scientists are always ready to update their ideas when new evidence appears.
As we saw in [Figure 2], data displays help us notice when a pattern continues and when it changes. And the seasonal changes in living things from [Figure 3] remind us that patterns connect Earth's systems and life. By observing carefully, organizing data, and thinking about repeated change, we can make predictions that are thoughtful, useful, and based on evidence.