If Earth's entire history were squeezed into a single calendar year, humans would appear only in the last tiny part of the very last day. That surprising fact shows why scientists need special ways to think about scale. Some Earth processes are too huge to see all at once, like moving tectonic plates. Others are too tiny, like mineral crystals inside a rock. Some changes happen too slowly for a person to watch, like the buildup of rock layers over millions of years. To study all of this, scientists use models.
A system is a group of parts that interact with one another. Earth is a system made of smaller systems: the atmosphere, oceans, land, and living things all affect one another. A storm system, a river system, and even a volcano can each be studied as systems.
A model is a simplified representation of something real. A globe is a model of Earth. A diagram of rock layers is a model of what geologists observe underground. A computer simulation of climate is also a model. Models help scientists focus on the most important features without being overwhelmed by every detail.
Scale means the size, distance, or time range of something being studied. Models are tools that represent objects, systems, or processes. Systems are sets of connected parts that affect one another.
Think about a city map on a phone. It leaves out tiny cracks in the sidewalk because those details are not useful for navigation. In the same way, a scientific model includes what matters most for the question being asked. A model is not a perfect copy of reality. Its job is to help people explain, predict, and test ideas.
Scientists also compare different kinds of scale. Time scale asks how long something takes. Space scale asks how large or small something is. Energy scale asks how much energy is moving or changing in a system. Earth science uses all three at once.
[Figure 1] Earth is about 4.6 billion years old, a number so large that it is hard to picture. This is why scientists use the geologic time scale, a model that organizes Earth's past into sections based on major changes recorded in rocks and fossils.
People can observe a sunset in minutes or a season in months, but no human can directly watch millions of years of mountain building or the slow layering of sediments at the bottom of an ancient sea. To understand such slow change, scientists rely on evidence preserved in rocks. They also use timelines, charts, and cross-sections to make deep time easier to study.
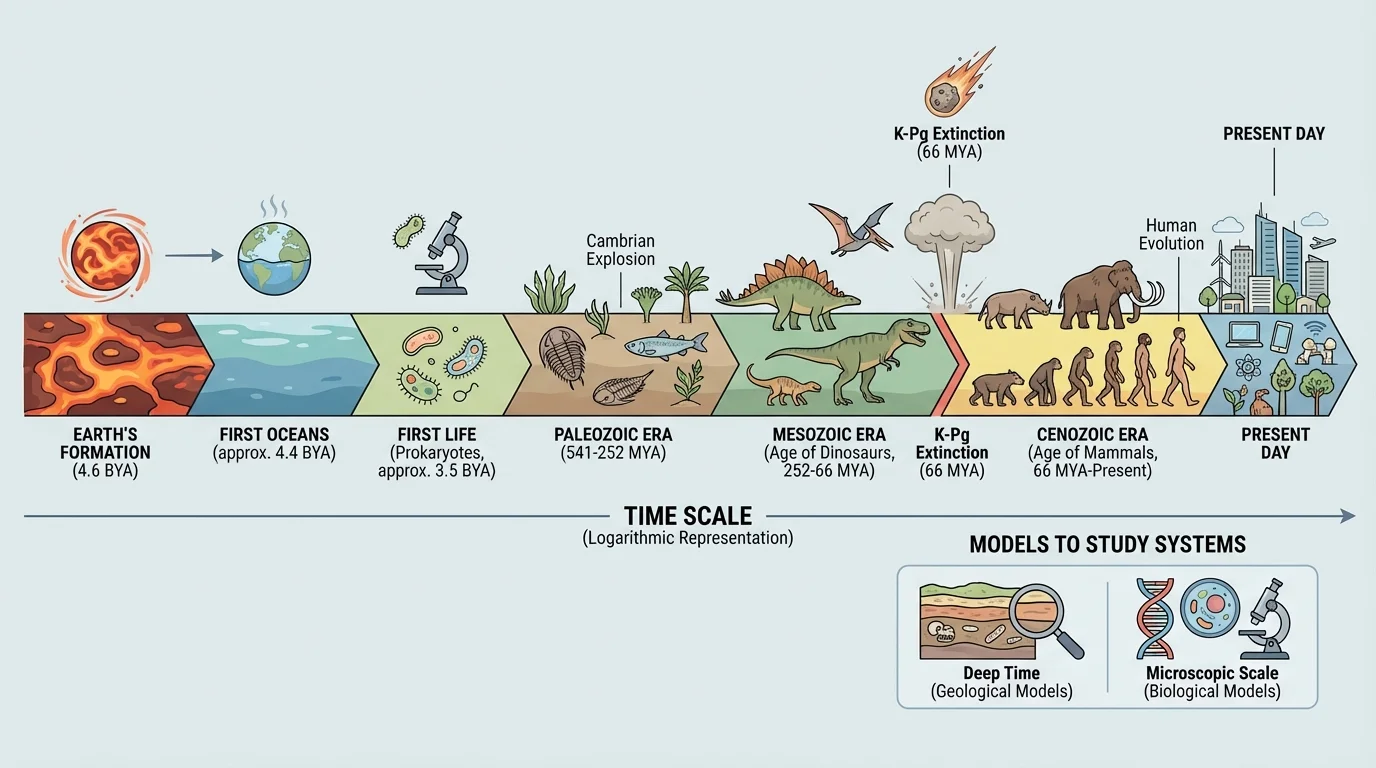
One useful model compares Earth's history to one year. In that model, Earth forms on January 1. The first simple life appears much later. Dinosaurs appear only near the end of the year. Humans appear in the final moments of December 31. This comparison is not exact in every detail, but it helps reveal how brief human history is compared with Earth history.
For most of Earth's history, there were no humans, no dinosaurs, and not even complex plants on land. Tiny organisms dominated the planet for billions of years.
Scientists call this enormous span of time deep time. Deep time reminds us that Earth has changed again and again. Continents moved, oceans opened and closed, mountains rose, and living things evolved. The geologic time scale helps scientists organize those changes into a pattern that makes sense.
Layers of rock can act like pages in a history book. Rocks are one of the best records of Earth's past. A sequence of strata is a set of rock layers, usually formed when sediments settle over time. Newer layers are often deposited on top of older ones.
[Figure 2] This idea is called the law of superposition. In an undisturbed stack of sedimentary rocks, the oldest layer is at the bottom and the youngest is at the top. This does not tell the exact age in years, but it does tell the relative order of events. Relative age means knowing whether something is older or younger than something else.
Rock layers may also contain fossils, which are preserved remains or traces of ancient organisms. Fossils help scientists match layers from different locations. If two rock layers far apart contain the same kinds of important fossils, scientists may infer that those layers formed during the same time period.
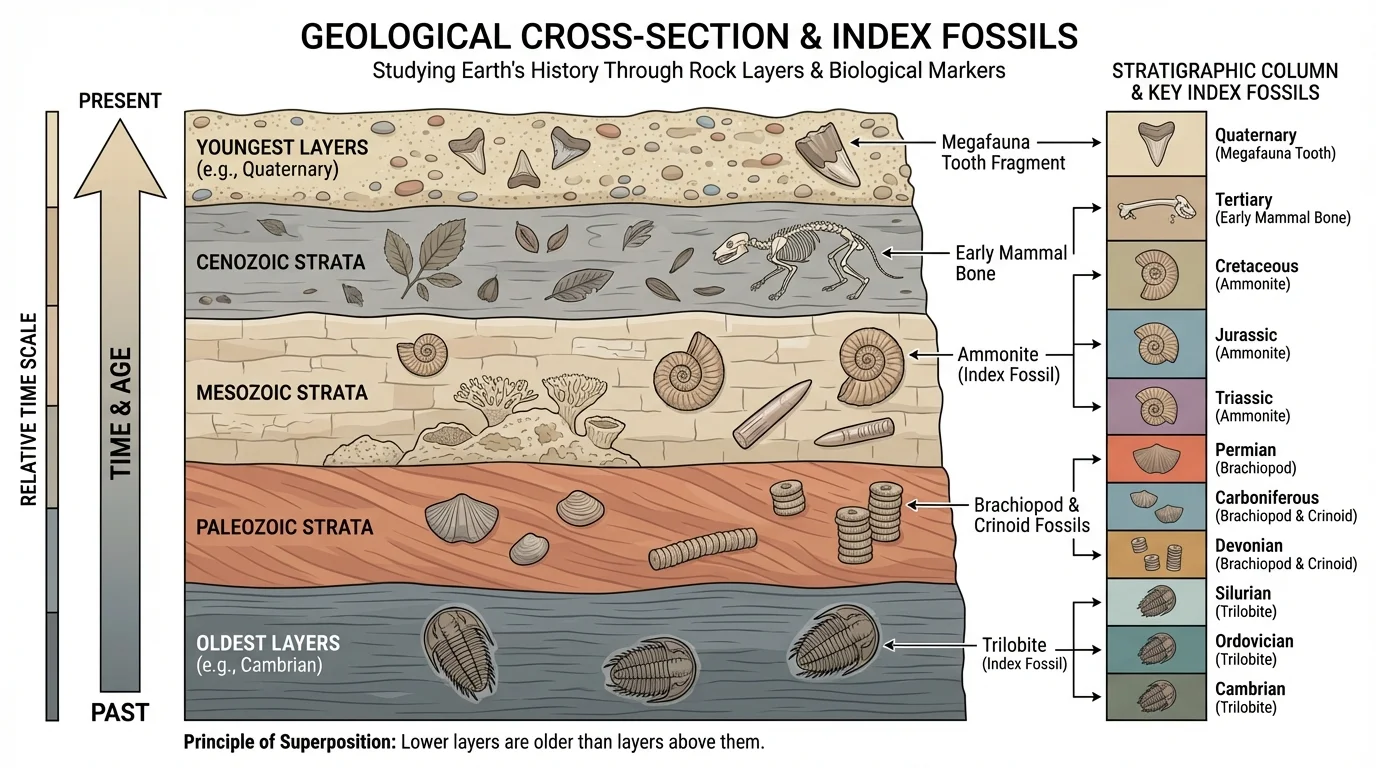
Some fossils are especially useful for dating layers. These are called index fossils. An index fossil belongs to a species that was widespread but lived for a relatively short time. Because that species existed during a limited span, its fossil helps identify the age of the rock layer in which it is found.
How rock strata support scientific explanations
Scientists do not simply look at one rock and guess its age. They build explanations from several kinds of evidence: the order of layers, the types of rocks present, the fossils in those rocks, and comparisons with other places. When many lines of evidence agree, the explanation becomes stronger.
For example, suppose one cliff has a sandstone layer with a certain marine fossil, and another cliff many kilometers away has the same fossil in a similar sandstone layer. Scientists can correlate those layers, meaning they can match them as likely formed at about the same time. Correlation helps build a larger picture of Earth history across wide regions.
Rocks also record changes in environments. A layer with ripple marks may show shallow water. A layer with volcanic ash shows an eruption. A coal layer suggests ancient swampy plant material. These clues help scientists explain not just when something happened, but also what kind of environment existed at that time.
The geologic time scale divides Earth's history into large divisions that are easier to study. The biggest divisions are eons, which are divided into eras, then periods, and then epochs. These divisions are based on major events visible in the rock record, such as mass extinctions, the appearance of new life forms, or major environmental changes.
Scientists did not create this scale all at once. It was built gradually as more rock evidence was collected. Long before scientists could measure exact ages using radioactive methods, they used strata and fossils to work out the sequence of Earth history. Later, absolute dating methods added age estimates in years, strengthening the time scale.
As seen earlier in [Figure 1], some parts of Earth history are much longer than others. Human history takes up only a tiny fraction of the whole scale. This is one reason timelines are so important: without a visual model, our brains tend to treat all past events as if they were equally far away.
| Division | What It Means | Example of What Scientists Study |
|---|---|---|
| Eon | Largest major division of geologic time | Very broad changes in Earth and life |
| Era | Subdivision of an eon | Major changes such as dominance of certain life forms |
| Period | Subdivision of an era | Specific rock records and fossil groups |
| Epoch | Smaller division within a period | More detailed recent environmental change |
Table 1. The main divisions scientists use to organize geologic time.
A key idea is that the geologic time scale is not just a list of names. It is a scientific model built from evidence. Rock strata, fossils, and later age measurements all help scientists explain how Earth's 4.6-billion-year history is organized.
[Figure 3] Earth science requires scientists to zoom in and zoom out across huge differences in size. A geologist may study a tiny mineral grain under a microscope, then step back to examine an entire mountain range, and then step even farther back to compare continents from satellite images.
A single rock sample might contain crystals too small to see clearly with the naked eye. Yet those crystals can reveal how the rock formed. At a much larger scale, the arrangement of many rock layers across a region can reveal ancient seas, rivers, deserts, or volcanic activity.
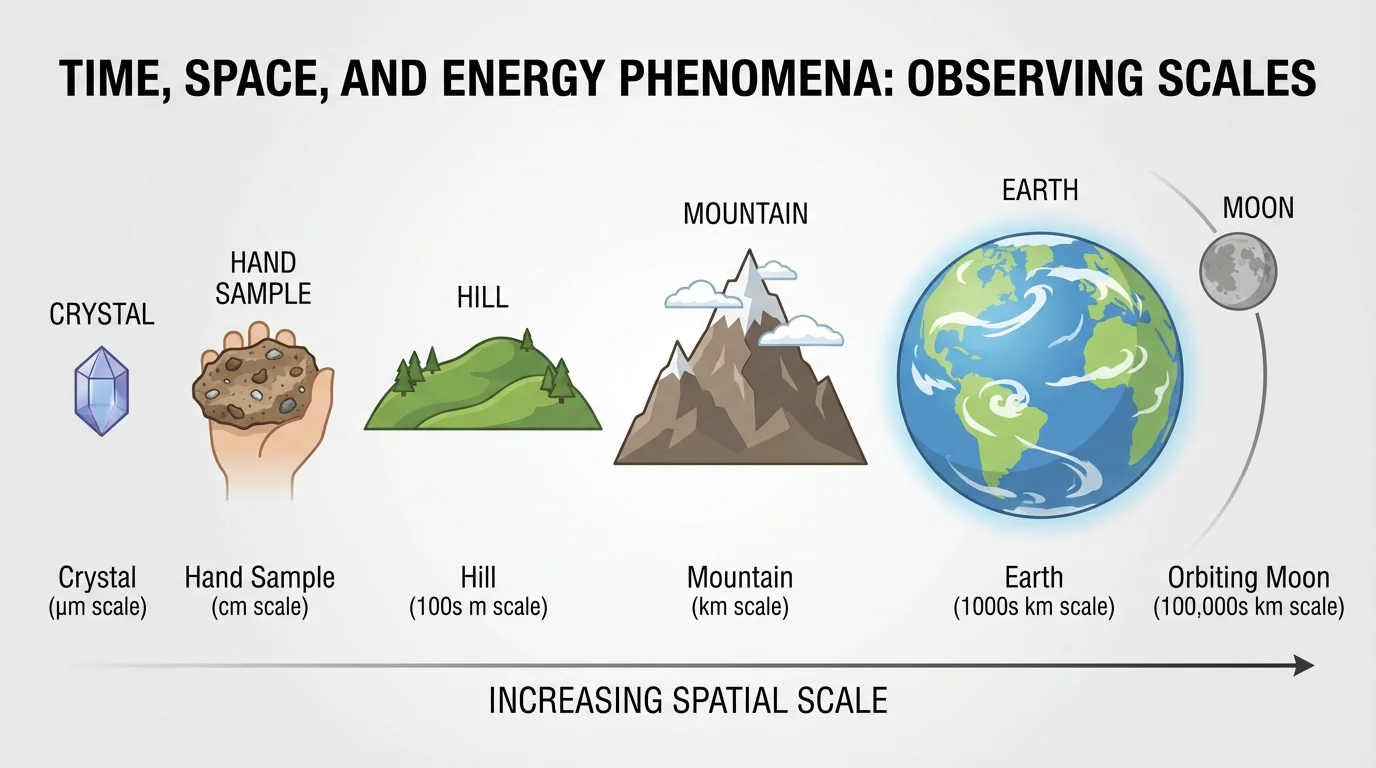
Space scale also matters in astronomy. Earth is large compared with a person, but tiny compared with the Sun. The Moon is close enough to affect tides, yet still very far away by everyday standards. Models help students and scientists compare these distances, because direct experience does not prepare us well for such extremes.
Measurements can describe scale in different ways. Length may be measured in millimeters, meters, or kilometers. Time may be measured in seconds, years, or millions of years. Choosing the right unit helps make a model useful.
Scientists often use maps, cross-sections, and scaled diagrams because the real world is simply too big. No one can hold a continent in their hand or watch an entire ocean current from above without technology. Models make these giant systems understandable.
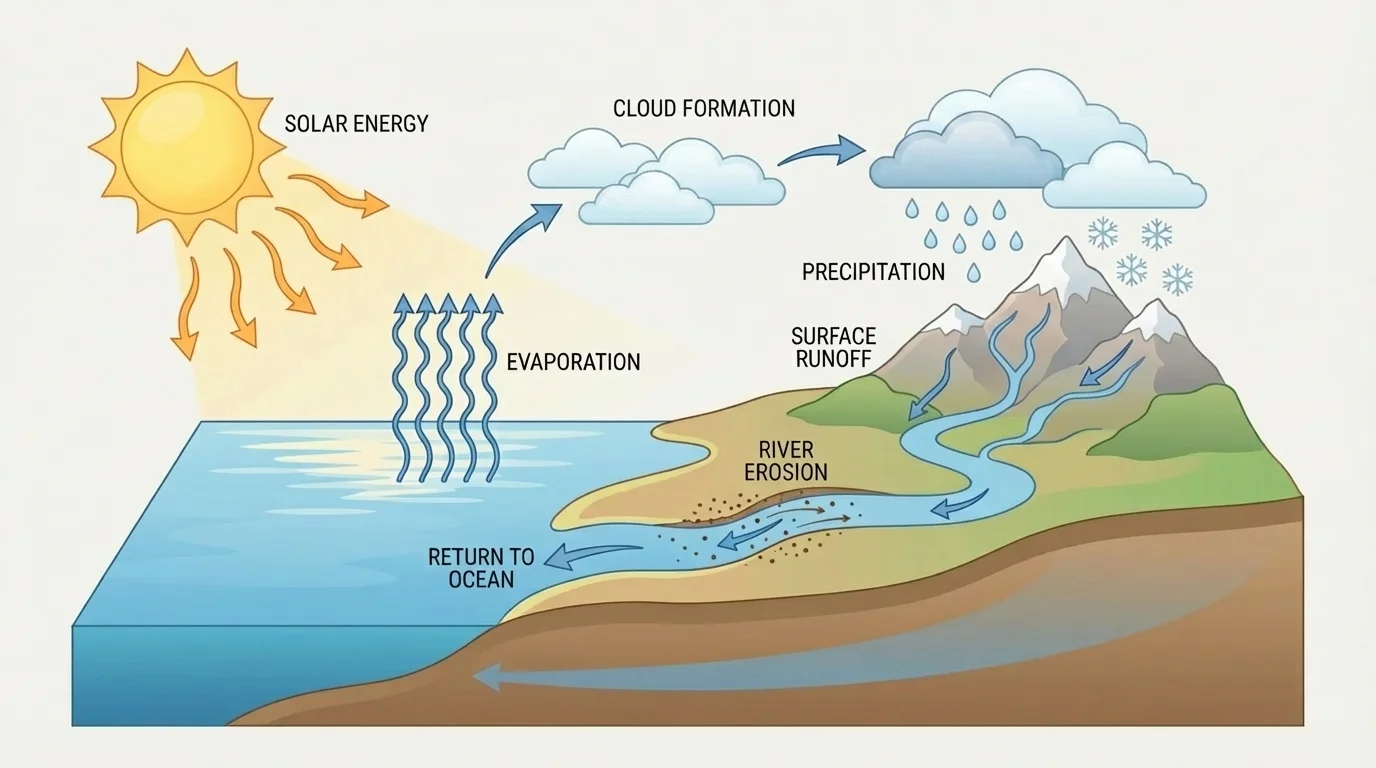
One major example of how many Earth changes are driven by energy is the water cycle. The Sun provides energy that warms Earth's surface and causes water to evaporate. Gravity then helps move water downhill as rain, rivers, and runoff. Together, solar energy and gravity shape landscapes over time.
[Figure 4] Energy also drives winds, ocean currents, weather, and many forms of erosion. Deep inside Earth, heat energy helps power convection in the mantle, which is connected to plate movement. Those plate motions can build mountains, trigger earthquakes, and feed volcanoes.
Because these changes happen at different rates, scientists use models to connect energy with time. A river may carve a canyon slowly over millions of years, while a landslide can happen in minutes. Both involve energy, but on very different time scales.
One simple mathematical relationship scientists use is speed. Speed tells how far something moves in a certain amount of time:
\[v = \frac{d}{t}\]
Here, \(v\) is speed, \(d\) is distance, and \(t\) is time. Suppose a tectonic plate moves \(3 \textrm{ cm}\) in \(1\) year. Then its average speed is \(v = \dfrac{3 \textrm{ cm}}{1 \textrm{ year}} = 3 \textrm{ cm/year}\). That seems slow, but over \(1{,}000{,}000\) years it would move \(3{,}000{,}000 \textrm{ cm}\), which is \(30 \textrm{ km}\). Tiny yearly motion can create huge change over deep time.
Real-world example: small motion, big result
A plate moves at an average speed of \(5 \textrm{ cm/year}\). How far does it move in \(2{,}000{,}000\) years?
Step 1: Use the relationship between distance, speed, and time.
\(d = vt\)
Step 2: Substitute the values.
\(d = 5 \textrm{ cm/year} \times 2{,}000{,}000 \textrm{ years} = 10{,}000{,}000 \textrm{ cm}\)
Step 3: Convert to kilometers.
Since \(100{,}000 \textrm{ cm} = 1 \textrm{ km}\), \(10{,}000{,}000 \textrm{ cm} = 100 \textrm{ km}\).
The plate moves 100 kilometers over that time. This shows why very slow processes can still reshape Earth.
Later, when scientists study changing coastlines or spreading seafloors, they may return to the kind of energy-flow picture shown in [Figure 4]. The details differ from place to place, but the basic idea remains: energy transfer causes motion, and motion causes change.
Different questions need different models. A physical model might be a layered clay structure showing rock strata. A visual model might be a timeline or cross-section. A mathematical model may describe the rate of erosion or plate motion. A computer model can simulate climate patterns or tectonic movement over long periods.
Every model has strengths and limits. A globe shows Earth's shape well, but not every local street. A map shows locations clearly, but it flattens a round planet. A geologic timeline organizes events, but it cannot show every local detail from every region at once. Good scientists ask both, "How does this model help?" and "What does this model leave out?"
Why models matter in science
Models are not just classroom tools. They are central to real scientific work. Scientists use them to test ideas, compare evidence, communicate findings, and make predictions about events that are too large, too small, or too slow to directly observe.
For example, no scientist can stand far enough away to watch all Earth's plates moving at once with the naked eye, and no one can directly observe a whole mountain range forming over tens of millions of years. But by combining measurements, rock evidence, and models, scientists can explain these processes with strong evidence.
Understanding scale helps people make decisions in everyday life and in major public projects. Engineers and planners use geologic maps and rock records when deciding where to build roads, tunnels, and dams. They need to know what kinds of rocks are present, how stable the ground is, and whether faults or erosion may cause problems.
Fossils and rock layers also help scientists locate resources such as groundwater, coal, oil, and natural gas. In hazard science, models help predict volcanic ash spread, flood risk, or landslide danger. Satellite data let scientists study large systems like hurricanes, glaciers, and desert dust movement across continents.
Climate scientists also depend on scale thinking. They compare short-term weather with long-term climate patterns. They examine tiny particles in the atmosphere, huge ocean systems, and long records preserved in rocks and ice. These records reveal that Earth's systems have changed in the past and can change again.
"The present is the key to the past."
— A guiding idea in geology
This famous idea in geology means that processes we observe today, such as sediment being deposited by rivers or lava cooling after eruptions, can help explain similar features preserved in ancient rocks. Present-day observations become models for interpreting the past.
When scientists compare modern river sediments with ancient sedimentary rocks, or modern coral reefs with limestone layers from long ago, they use the same careful logic seen in [Figure 2]. Evidence from strata helps connect local observations to the much larger story of Earth history.