Look closely at a group of puppies, a patch of flowers, or a flock of birds, and you will notice something surprising: they are alike, but not exactly the same. One puppy may have black fur while another has brown fur. One flower may have deep purple petals while another has light purple petals. Scientists study these differences by collecting information, or data, and then using that data to look for patterns. When we analyze and interpret data, we turn a bunch of observations into evidence that helps explain what is happening in nature.
Scientists do not just guess. They observe carefully, record what they see, and compare results. Data can be numbers, words, drawings, or measurements. For students in science, data often begin with simple counts such as "how many plants have yellow flowers?" or "how many rabbits have long ears?"
When scientists study living things, data help answer questions such as: Which traits are common in a group? Which traits are less common? Are the traits inherited from parents? Do some traits help organisms live better in a certain place? These questions can be answered more clearly when observations are organized and compared.
Trait means a characteristic of a living thing, such as fur color, leaf shape, eye color, or beak size. An inherited trait is a trait passed from parents to offspring. Variation means differences in traits among members of the same species.
For example, all sunflowers in a garden are still sunflowers, but they may vary in height, petal size, or seed pattern. All kittens in one litter are still kittens, but their fur colors or stripe patterns may differ. The important idea is that members of the same group can share many features while still showing variation.
Every plant and animal has traits. Some traits are easy to see, like feather color or flower shape. Other traits are harder to notice, like how a plant resists dry weather or how an animal behaves. In this lesson, we focus mostly on visible traits because they are easier to count and compare.
When we say a trait is inherited, we mean it comes from parents. A young cat may inherit fur color from its parents. A bean plant may inherit seed shape from the plant it came from. This does not mean all offspring look exactly the same. In fact, variation is normal. A group of similar organisms often shows a mix of traits.
Scientists study this variation by looking at many individuals in a group, not just one. If you looked at only one puppy, you would learn almost nothing about variation in a litter. But if you looked at all the puppies and counted their traits, you could start to see a pattern.
To analyze data means to study it carefully and look for patterns. To interpret data means to explain what the pattern may mean. Scientists often organize observations into tables, tally charts, or bar graphs. A simple chart, as shown in [Figure 1], makes it easier to compare categories and notice which traits appear more often.
Suppose a class observes rabbits on a farm. Students may sort the rabbits by ear type: upright ears or floppy ears. Then they count how many rabbits fit each group. Instead of keeping the information only in their heads, they record it so they can compare the numbers clearly.
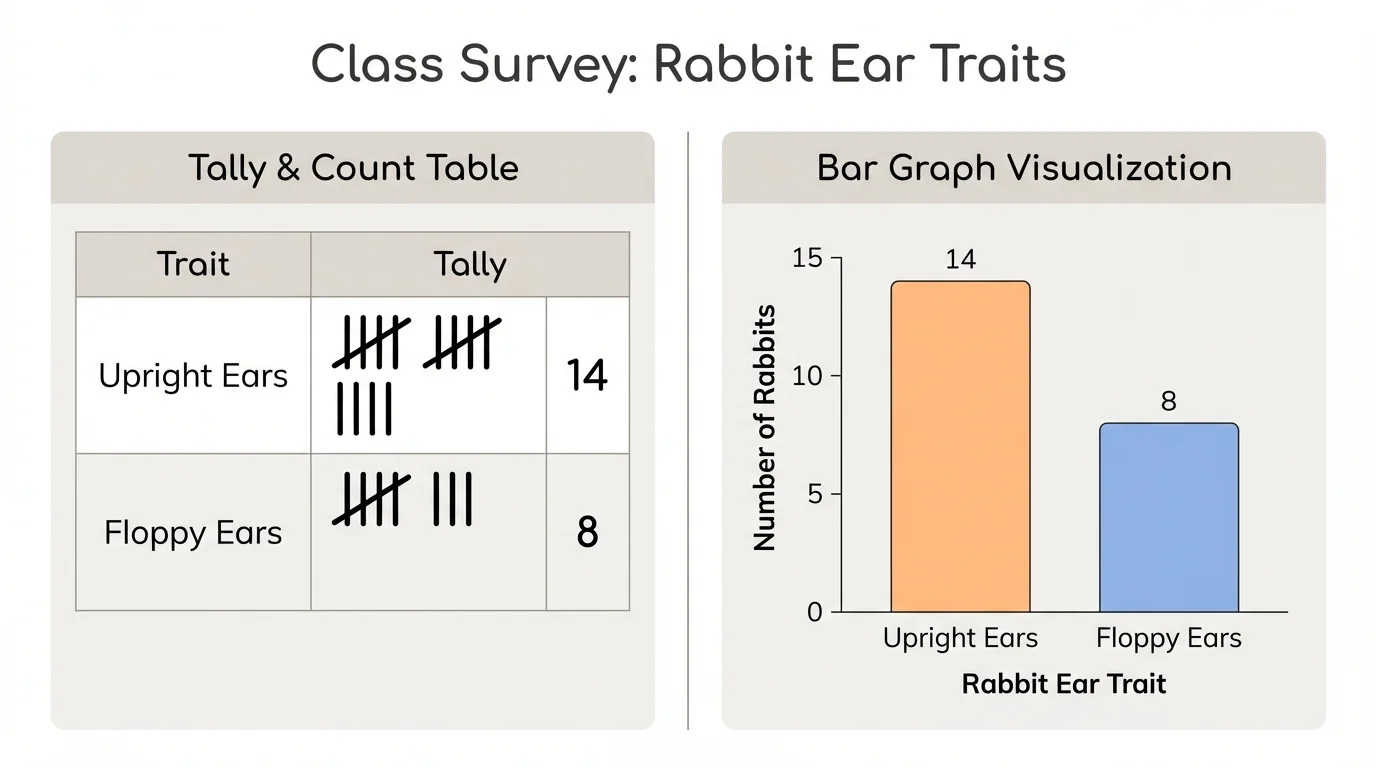
Once the data are organized, scientists ask questions such as: Which group has more? How many more? Are the numbers close together or very different? If there are many more rabbits with upright ears than floppy ears, that suggests upright ears are more common in that group.
Here are some simple ways to analyze data:
These steps help turn observations into evidence. Evidence is stronger when it comes from careful counting and clear records, not from guessing or noticing only one example.
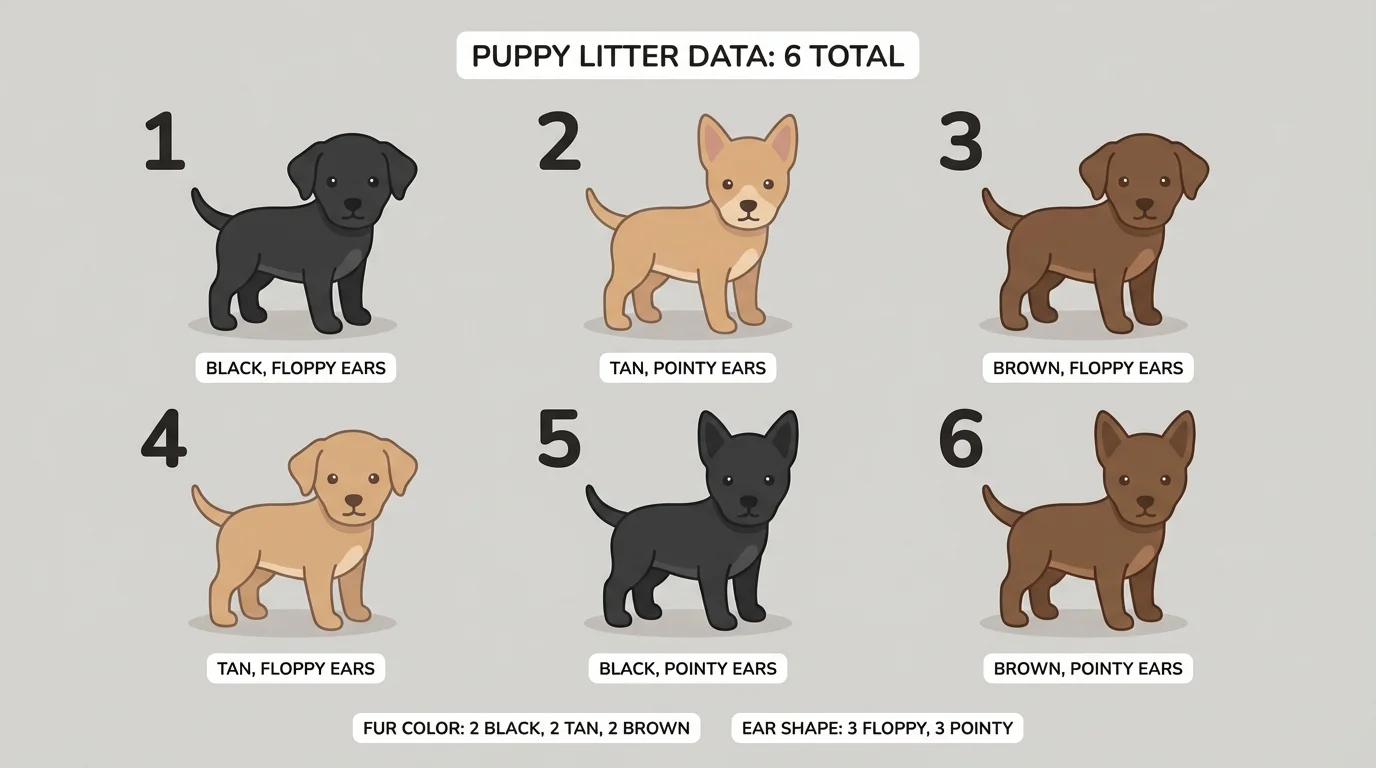
A litter of puppies is a great example of variation within a similar group. The puppies all have the same animal parents, yet they may differ in fur color, spots, tail length, or ear shape. The litter example in [Figure 2] helps us compare traits within one group and see how inherited variation can appear clearly.
Suppose one litter has six puppies. A student observes their fur color and finds the following data: three black puppies, two brown puppies, and one white puppy. The student can use these counts to describe the group.
From this information, the student can say that black fur is the most common fur color in this litter because it appears in three puppies. White fur is the least common because it appears in one puppy. That claim is based on evidence, not opinion.
Worked example: interpreting puppy data
A litter has six puppies. Their fur colors are black, black, black, brown, brown, and white.
Step 1: Count each trait category.
Black: \(3\), brown: \(2\), white: \(1\).
Step 2: Find the total number of puppies.
\(3 + 2 + 1 = 6\).
Step 3: Compare the categories.
Black fur appears most often because \(3\) is greater than \(2\) and \(1\).
Step 4: Describe a fraction of the group.
The fraction with black fur is \(\dfrac{3}{6}\), which is half the litter.
The data provide evidence that fur color varies within this litter, even though all six puppies belong to the same group.
This example does not mean every litter of puppies will have the same pattern. A different litter might have more brown puppies or no white puppies at all. Scientists understand this by collecting data from many groups and comparing results.
Plants also show inherited variation. Imagine that a class plants bean seeds from the same kind of bean plant. When the plants grow, students notice that some pods are longer, some are shorter, and some seeds are darker than others. Because the plants are similar organisms, these differences are examples of variation within a group.
Suppose students count flower color in twelve bean plants. They find eight plants with white flowers and four plants with purple flowers. These numbers can be organized in a table.
| Flower Color | Number of Bean Plants |
|---|---|
| White | \(8\) |
| Purple | \(4\) |
| Total | \(12\) |
Table 1. Counts of flower colors in a group of twelve bean plants.
From the table, students can tell that white flowers are more common in this group. They can also find how many more by subtracting: \(8 - 4 = 4\). So there are four more plants with white flowers than purple flowers.
What a pattern tells us
A pattern in data does not tell us everything, but it gives us evidence. If a trait appears again and again in a group, that suggests it is common in that group. If a trait appears only a few times, it is less common. Patterns help scientists make explanations that fit the observations.
Students can go further and describe parts of the whole group. The fraction with purple flowers is \(\dfrac{4}{12}\). The fraction with white flowers is \(\dfrac{8}{12}\). Even without simplifying the fractions, students can see that \(\dfrac{8}{12}\) is greater than \(\dfrac{4}{12}\), so white flowers are more frequent.
Math is a powerful tool in science. When scientists count and compare traits, they often use addition, subtraction, and fractions. These simple tools help make patterns easier to understand.
If a group has ten birds and seven have short beaks while three have long beaks, we can describe the data in several ways. We can say short beaks are more common. We can say the difference is \(7 - 3 = 4\) birds. We can also say \(\dfrac{7}{10}\) of the birds have short beaks.
Using numbers makes the explanation stronger. Saying "I think there are a lot of short beaks" is weaker than saying "\(\dfrac{7}{10}\) of the birds have short beaks." The second statement gives exact evidence.
Worked example: comparing bird beaks
A class observes ten birds. Seven have short beaks, and three have long beaks.
Step 1: State the counts.
Short beaks: \(7\). Long beaks: \(3\).
Step 2: Find how many more birds have short beaks.
\(7 - 3 = 4\).
Step 3: Write a fraction for each group.
Short beaks: \(\dfrac{7}{10}\). Long beaks: \(\dfrac{3}{10}\).
The data show that short beaks are more common in this group of birds.
Sometimes scientists also compare data from different places or times. If one garden has mostly tall plants and another has mostly short plants, scientists ask what might explain the difference. They may look at soil, water, sunlight, or which parent plants were used.
Data about traits do more than describe a group. They can also help explain how organisms live in different places. A habitat is the place where an organism lives. Some inherited traits help organisms survive well in their habitats, as [Figure 3] illustrates with different bird beaks and food sources.
Think about birds. A bird with a strong, thick beak may crack seeds easily. A bird with a long, thin beak may be better at reaching into flowers or catching insects. If scientists collect data on beak shape and the foods available in an area, they may find a pattern between traits and available food sources, which can help explain survival.
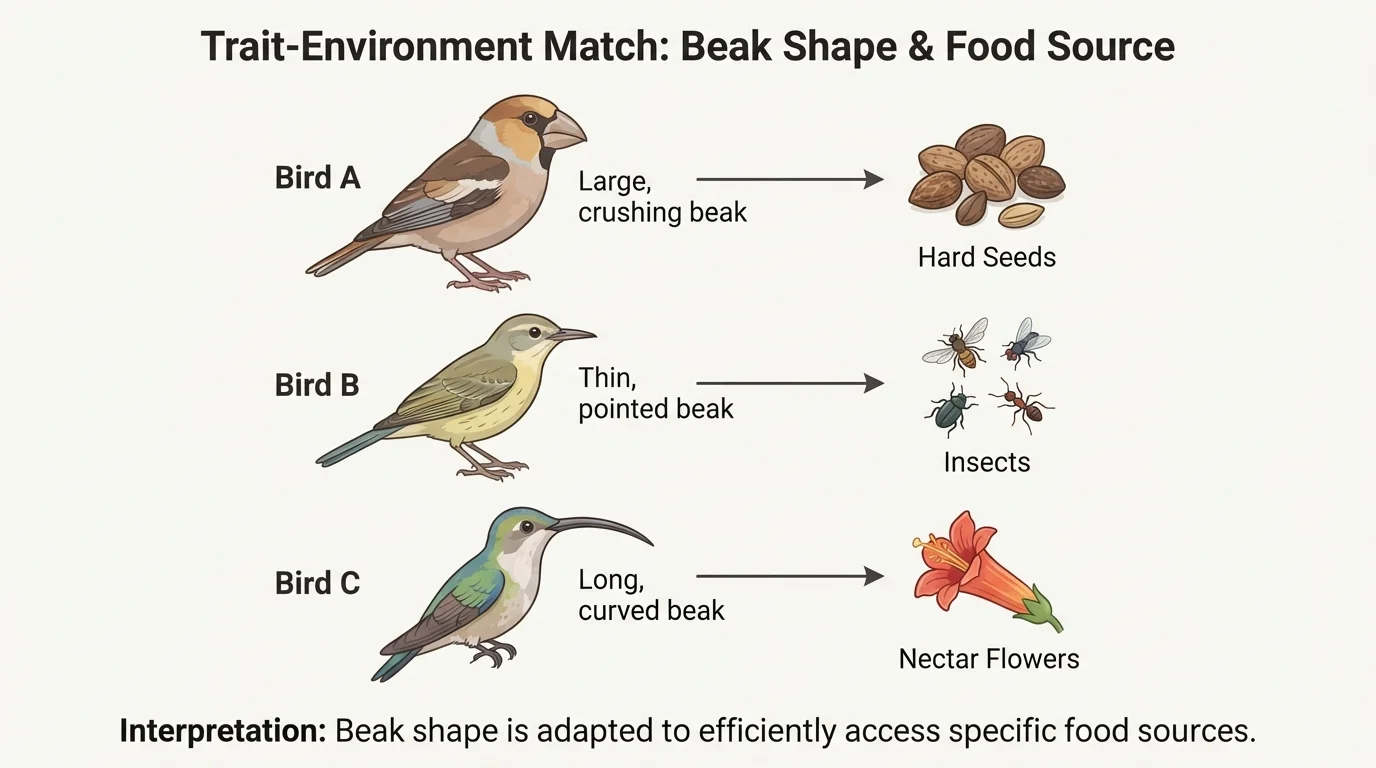
Suppose scientists observe birds on an island where hard seeds are common. They count many birds with thick beaks and fewer birds with thin beaks. That pattern suggests thick beaks may help birds get food in that habitat. The data do not prove the idea all by themselves, but they provide evidence that supports it.
This is important because living things that are well suited to their surroundings are more likely to survive and reproduce. Over time, traits that help survival in a habitat may become common in a group. Earlier, [Figure 1] showed how a chart makes trait patterns easier to compare. Scientists use the same kind of organized evidence when they study traits connected to survival.
Some scientists can learn about animal populations just by counting visible traits in photos taken by cameras in the wild. Patterned fur, antler shape, or feather color can help them track groups over time.
Plants also show this connection. In dry places, plants with traits that help hold water may survive better. In shady forests, plants with broad leaves may gather light more effectively. Scientists compare traits and conditions to understand why certain organisms do well in certain habitats.
Good science means being careful. One important rule is not to make a big claim from a tiny amount of data. If you observe only two flowers, you cannot know much about variation in all flowers of that kind. Larger groups usually give stronger evidence.
Another rule is to compare fairly. If one student counts healthy plants and another counts damaged plants, their data may not match for reasons other than inherited traits. Scientists try to keep their observations organized and clear so they can make fair comparisons.
Scientists also know that not every difference comes from inheritance alone. Some traits are shaped by surroundings. A plant may grow taller because it gets more water and sunlight. That is why scientists ask careful questions: Is this trait inherited? Is it affected by the environment? Do we have enough evidence?
When students explain data, they should use words like suggests, shows, and provides evidence. These are better than saying something is true just because it appeared once. The puppy example in [Figure 2] shows visible variation in one litter, but scientists would still study more litters to learn about broader patterns.
Analyzing trait data is useful in everyday life and real jobs. Farmers compare traits in crops, such as fruit size, color, or resistance to dry weather. Gardeners notice which plants grow best in certain soils. Veterinarians may observe inherited features in animal families. Wildlife scientists collect data on traits to study populations in nature.
For example, a farmer may count how many tomato plants produce red fruit and how many produce yellow fruit. If the farmer wants to save seeds from plants with a certain trait, careful records matter. The farmer is using data to make decisions based on evidence.
Wildlife scientists may also compare animals in different habitats. If a population of rabbits in snowy places mostly has white fur in winter, that pattern may suggest white fur helps them blend in. If another population in brown grasslands mostly has brown fur, scientists ask how those traits match the habitat and survival needs.
When you studied observation skills earlier, you learned that scientists notice details, record them, and compare them. This lesson builds on that idea by showing how organized observations become evidence.
Computers can help with this work too. Scientists may enter counts into spreadsheets, make graphs quickly, and compare large sets of data. Even though computers are useful, the thinking still matters most. Scientists must decide what to count, how to organize the information, and what conclusions are supported by the evidence.
Plants and animals inherit traits from parents, but members of the same group are not exactly alike. Variation is a natural part of life. By counting and comparing traits, scientists can describe this variation clearly.
Data become meaningful when we organize them into tables, charts, or graphs and then ask careful questions. Which trait is most common? Which is least common? How many more? What fraction of the group has this trait? These questions turn raw observations into evidence-based explanations.
Sometimes data about traits also help explain which organisms are more likely to survive in a certain habitat. When a trait fits the environment well, it may be seen more often in that place. This does not mean every organism will have the same trait, but patterns in data can reveal useful clues.
The heart of scientific thinking is this: observe carefully, record honestly, compare fairly, use math when it helps, and make claims that match the evidence. That is how we make sense of the living world.