Have you ever used a globe, looked at a weather map, or seen a drawing of the solar system? None of those things is the real Earth, the real weather, or the real solar system. But each one helps people understand something important. That is exactly what scientists do when they create models. A model is a powerful tool for thinking about things that may be too big, too small, too far away, too slow, or too hard to study directly.
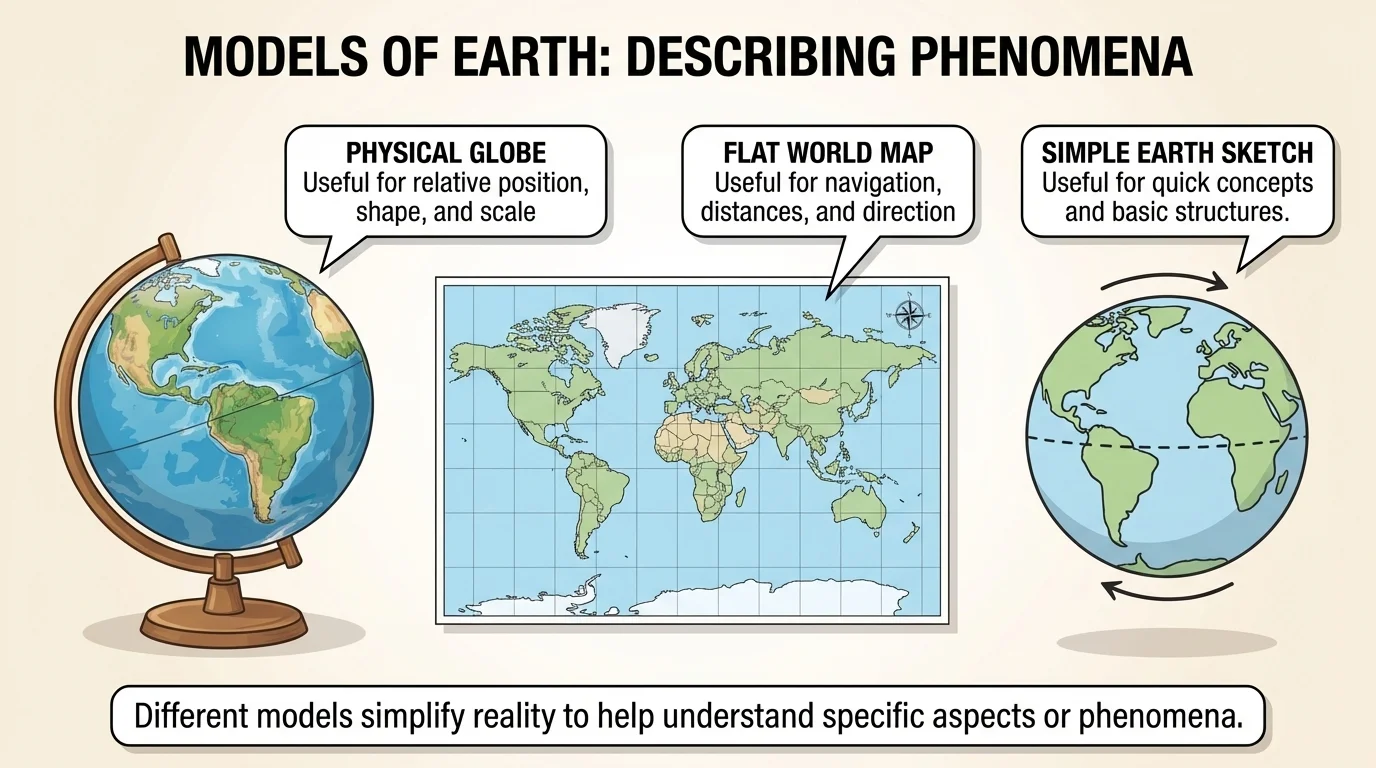
In science, a model is a simplified representation of something real. It helps explain how something looks, works, or changes. One real thing can have several useful models, as [Figure 1] shows with Earth represented in different ways. A globe, a map, and a sketch all leave out some details, but each helps us answer a different question.
A model does not have to be a small object you can hold. A model can be a drawing, a diagram, a set of words, a chart, or even a pattern using numbers. For example, a drawing of the water cycle is a model. A map of your town is a model. A simple explanation of how shadows change during the day is also a model.
Scientists make models because the real world can be very complicated. The inside of Earth cannot be opened up like a toy. The solar system is too huge to fit in a classroom. An atom is too tiny to see with your eyes. A storm changes too quickly to stop and study piece by piece. Models help us focus on the most important parts.
Model is a simplified representation of an object, system, or process that helps us describe, explain, or predict what happens.
Phenomenon is something that happens in nature and can be observed, such as rain, plant growth, shadows, or day and night.
When scientists say they want to develop a model to describe phenomena, they mean they want to build a useful way to show what is happening and why it happens. The model should match the evidence as well as possible.
Models help people do several important jobs. First, models help us describe what we observe. If you draw how the Moon seems to change shape over a month, your drawing model helps describe that pattern.
Second, models help us explain what causes something. For example, a model of Earth spinning helps explain why day turns into night. Third, models help us predict. If a weather model shows clouds moving toward your town, meteorologists can predict rain. Fourth, models help us share ideas with other people. A clear diagram can help another student understand your thinking.
Good models are not just pretty pictures. They are based on observations and evidence. If the evidence changes, the model may need to change too. That is one of the most exciting parts of science: scientists keep improving their explanations.
Scientists use models for things of many sizes, from tiny cells to giant galaxies. Some models are so small they fit on paper, and some are made with computers that study hurricanes, earthquakes, and space travel.
You already use models in daily life. A recipe is a model for how ingredients change into food. A toy car can be a model of a real car's shape. A school schedule models how time is organized during the day. These are not all scientific models, but they show the same main idea: a model helps people understand something more clearly.
There are different types of models, and each type is useful in a different way. A physical model is an object you can touch. A globe is a physical model of Earth. A model skeleton is a physical model of a body.
A diagram model is a drawing with labels. A food chain picture, a life cycle drawing, or a water cycle drawing is a diagram model. It helps show parts and how they connect.
A process model explains steps in order. For example, a model of how a seed becomes a plant may show these stages: seed, sprout, seedling, and full plant. It shows change over time.
A mathematical model shows a repeated relationship using numbers or equations. If a plant grows about the same amount each week, a chart of that growth can model the pattern. Suppose a seedling grows about \(2 \textrm{ cm}\) each week. A simple mathematical model might be \(h = 2w\), where \(h\) is height gained in centimeters and \(w\) is the number of weeks. If \(w = 3\), then \(h = 2 \times 3 = 6\). This kind of model uses numbers to describe change.
Words can also form a model. If you say, "When the Sun is lower in the sky, shadows become longer," you are using a verbal model to describe a phenomenon. It may not be a picture, but it still explains a relationship.
| Type of model | What it looks like | What it helps explain |
|---|---|---|
| Physical model | Globe, skeleton, building model | Shape and parts |
| Diagram model | Labeled drawing | Parts and connections |
| Process model | Step-by-step sequence | How something changes |
| Mathematical model | Chart or simple rule | Repeated relationships |
| Verbal model | Words and explanations | Cause and effect |
Table 1. Common kinds of models and what each one helps describe.
As we saw earlier with Earth in [Figure 1], different models of the same thing can all be useful. A globe shows Earth's round shape better than a flat map, but a flat map is easier when you want to see places all at once.
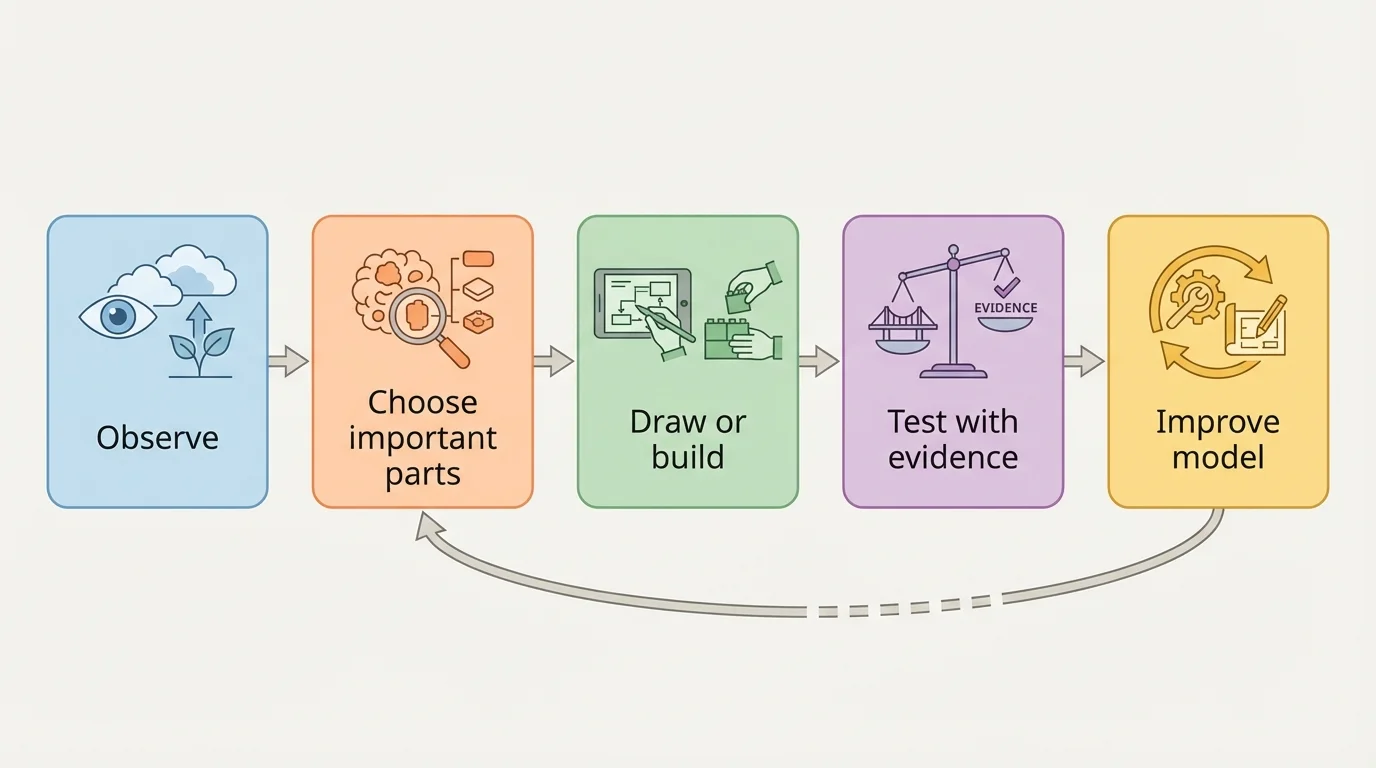
[Figure 2] shows a simple version of the careful process scientists follow when building models, and young scientists can use it too. To build a model, you first observe the phenomenon closely. Then you decide which parts matter most. Next, you create a representation. After that, you test whether the model matches what you see. Finally, you improve the model if needed.
Suppose you want to model why shadows change during the day. You might begin by observing a stick outside in the morning, at noon, and in the afternoon. You would notice that the shadow's length and direction change. Those observations give you evidence.
Then you choose the important parts: the Sun's position, the object, and the shadow. You probably do not need to include every cloud in the sky or every blade of grass nearby. A good model includes what matters most for the question you are asking.
Next, you represent the idea with a drawing, a flashlight and object, or a written explanation. Then you compare your model to real observations. If your model predicts a short shadow at noon and that matches what you observe, your model is useful. If it does not match, you revise it.
Example: Building a model of plant growth
A student wants to describe how a bean plant grows over time.
Step 1: Observe and record
The student measures the plant each week and notices it grows taller after getting water and sunlight.
Step 2: Choose the important parts
The student includes sunlight, water, soil, and plant height.
Step 3: Make the model
The student draws the plant each week and makes a simple height chart.
Step 4: Test and improve
If another plant with less sunlight grows more slowly, the model is improved to show that sunlight affects growth rate.
The final model explains not only that the plant grows, but also which conditions help it grow.
Notice that the model becomes stronger when it connects observations to causes. The goal is not just to copy what something looks like. The goal is to explain the phenomenon clearly and use evidence.
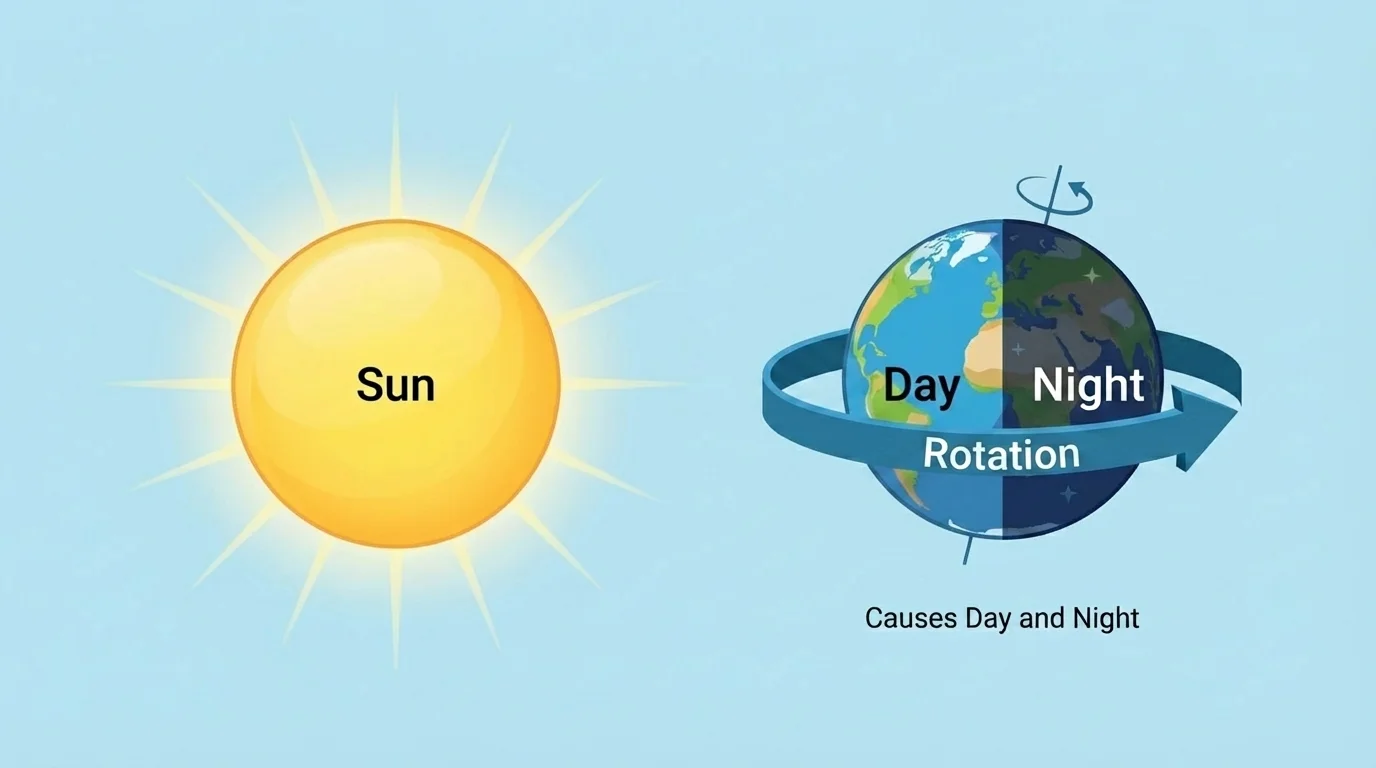
[Figure 3] helps explain one of the most familiar natural events: day and night. A simple Earth-Sun model shows sunlight reaching only one half of Earth at a time. As Earth rotates, different places move into sunlight and then out of it.
This model explains why it is daytime where sunlight hits Earth directly and nighttime on the side turned away from the Sun. The model does not need every mountain, ocean wave, or city light. It only needs the parts that matter for the question: the Sun, Earth, sunlight, and rotation.
Another common phenomenon is changing shadows. A flashlight and a small object can be used to model how sunlight creates shadows. When the light shines from high above, the shadow is shorter. When the light shines from a lower angle, the shadow is longer. This helps explain why shadows often look shortest around midday.
Plant growth is another phenomenon that can be modeled. A sequence drawing can show how a seed absorbs water, begins to sprout, grows roots, then grows leaves. A chart can show changes in height over time. If a plant starts at \(4 \textrm{ cm}\) and grows \(2 \textrm{ cm}\) each week for \(3\) weeks, its height after that time is \(4 + 2 \times 3 = 10 \textrm{ cm}\). The numbers support the visual model.
Weather is also described with models. Maps use colors, symbols, and arrows to represent temperature, wind, and rain. Real weather is always moving, so meteorologists use computer models to help predict what may happen next. Even though grade 4 students may not build computer weather models, they can understand that models help people prepare for storms.
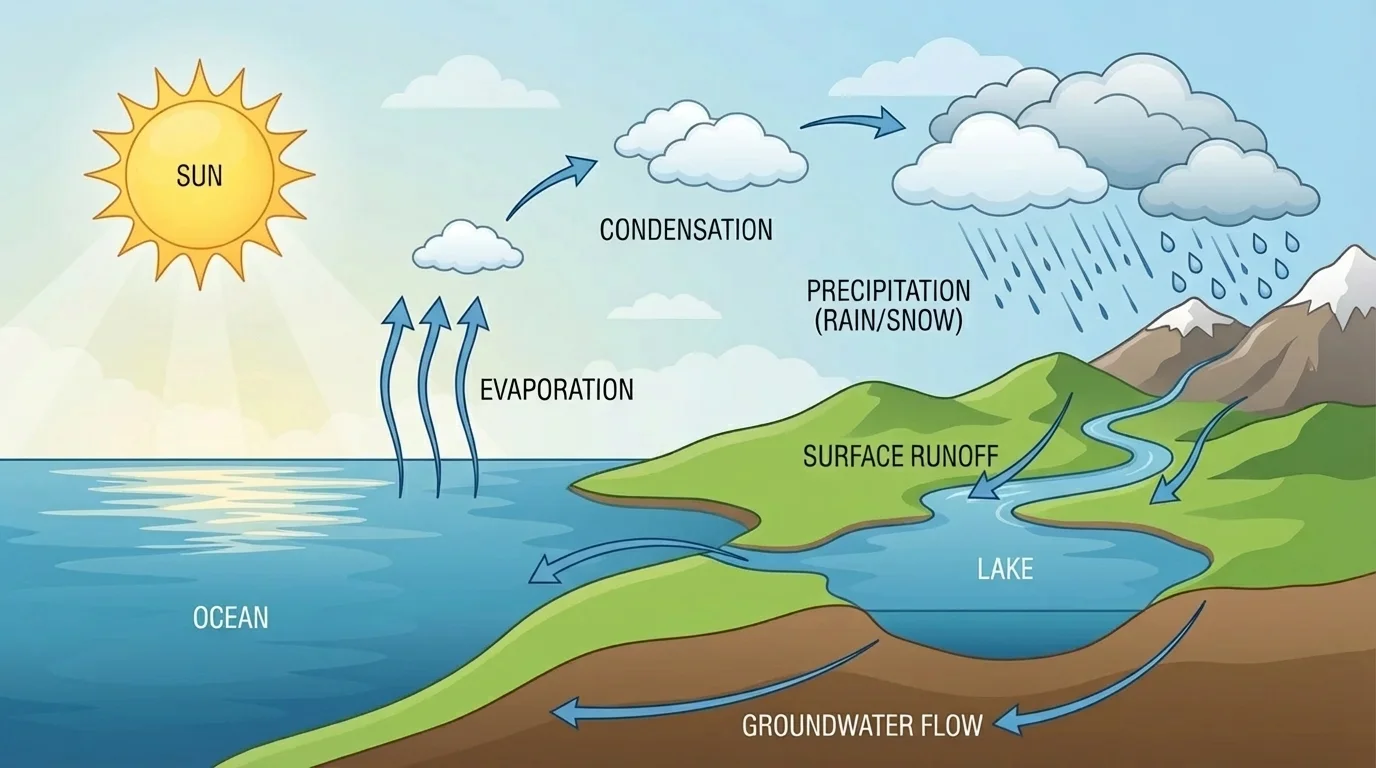
[Figure 4] shows the important steps in the water cycle, which is a great example of a process model. Water in lakes, rivers, and oceans is heated by the Sun. Some of that water changes into water vapor and rises into the air. Later it cools, forms clouds, and returns as rain or snow.
This model helps explain why water moves from the ground to the sky and back again. It also helps explain why rain can fill rivers and why puddles disappear after sunny weather. The model focuses on the main parts: heating, evaporation, condensation, precipitation, and collection.
Models connect cause and effect
A strong model does more than list parts. It shows relationships. In the day-and-night model, Earth's rotation causes the change from light to dark. In the water cycle model, heating causes evaporation, and cooling causes condensation. A model is most useful when it helps answer the question, "Why does this happen?"
Later, when you compare shadows, weather maps, or plant growth, you can think back to the spinning Earth in [Figure 3] and the moving water in [Figure 4]. Both models describe change over time by focusing on the key parts and the relationships between them.
Every model leaves something out. That is normal and useful. If a model included every detail of the real world, it would be just as confusing as the real world. A model is helpful because it is simpler.
But simpler does not mean perfect. A globe shows Earth's shape well, yet it may not show tiny roads. A map shows roads and cities, but it flattens Earth's curved surface. A drawing of the solar system can show the order of planets, but it usually does not show the true distances correctly. That is why scientists always ask, "What does this model show well, and what does it leave out?"
Earlier science learning about observing, measuring, and recording is important here. A model is only useful when it is connected to real observations and evidence.
Models can also change over time. If new observations do not fit the old model, scientists revise the model. That does not mean the old model was useless. It means science grows stronger by improving explanations.
Models are everywhere. Builders use scale models before making real buildings. Doctors use models of the human body to study organs and bones. Meteorologists use weather models to help warn people about storms. Engineers use models to test bridges, vehicles, and machines before building them full size.
In school, models help students explain ideas clearly. If you draw a food web, build a Moon-phase model, or create a chart of plant growth, you are doing the work of a scientist. You are choosing evidence, deciding what matters, and communicating your thinking.
Maps are another powerful example. A map is not the real land, but it helps travelers find places and helps scientists study habitats, rivers, and weather patterns. The same idea appears in many jobs: people use models because the real system may be too large, too expensive, or too dangerous to test directly.
Some scientists study volcanoes and hurricanes with computer models because testing the real event directly would be far too dangerous. The model lets them ask safe questions and make useful predictions.
The sequence of steps in [Figure 2] is not just for classroom science. Real scientists also observe, choose important features, test against evidence, and improve their models again and again.
Not every model is the best choice for every question. If you want to show the shape of Earth, a globe works well. If you want to plan a road trip, a map is better. If you want to explain how a plant changes over weeks, a sequence diagram or chart may be the best choice.
When choosing a model, ask a few smart questions. What am I trying to explain? Which details matter most? What can I leave out? Will my audience understand it? Does my model match the evidence?
That is why scientists often make more than one model. One model may show shape, another may show movement, and another may show patterns in data. Together, these models can give a fuller understanding of a phenomenon.
Developing and using models is one of the most important ways scientists think. It begins with curiosity: noticing something interesting in the world. Then it grows through observation, evidence, explanation, testing, and revision.
You do not need fancy machines to start modeling. A careful drawing, a simple chart, a flashlight and object, or a few clear sentences can all become useful models. What matters most is that the model helps describe a real phenomenon and is supported by what you observe.
When you make a model, you are not just making a picture. You are building an explanation. You are deciding what is important, showing relationships, and using evidence to make sense of the world. That is real scientific thinking.