A rumor can spread online in minutes, a disease can spread through a city in weeks, and a drought can build over years. In each case, people try to answer the same question: is there a real pattern here, or are we only noticing random events? That question matters because human beings are excellent at spotting shapes, repeats, and trends—but we are not always correct. To tell the difference between a meaningful pattern and a misleading impression, we need evidence gathered from the real world.
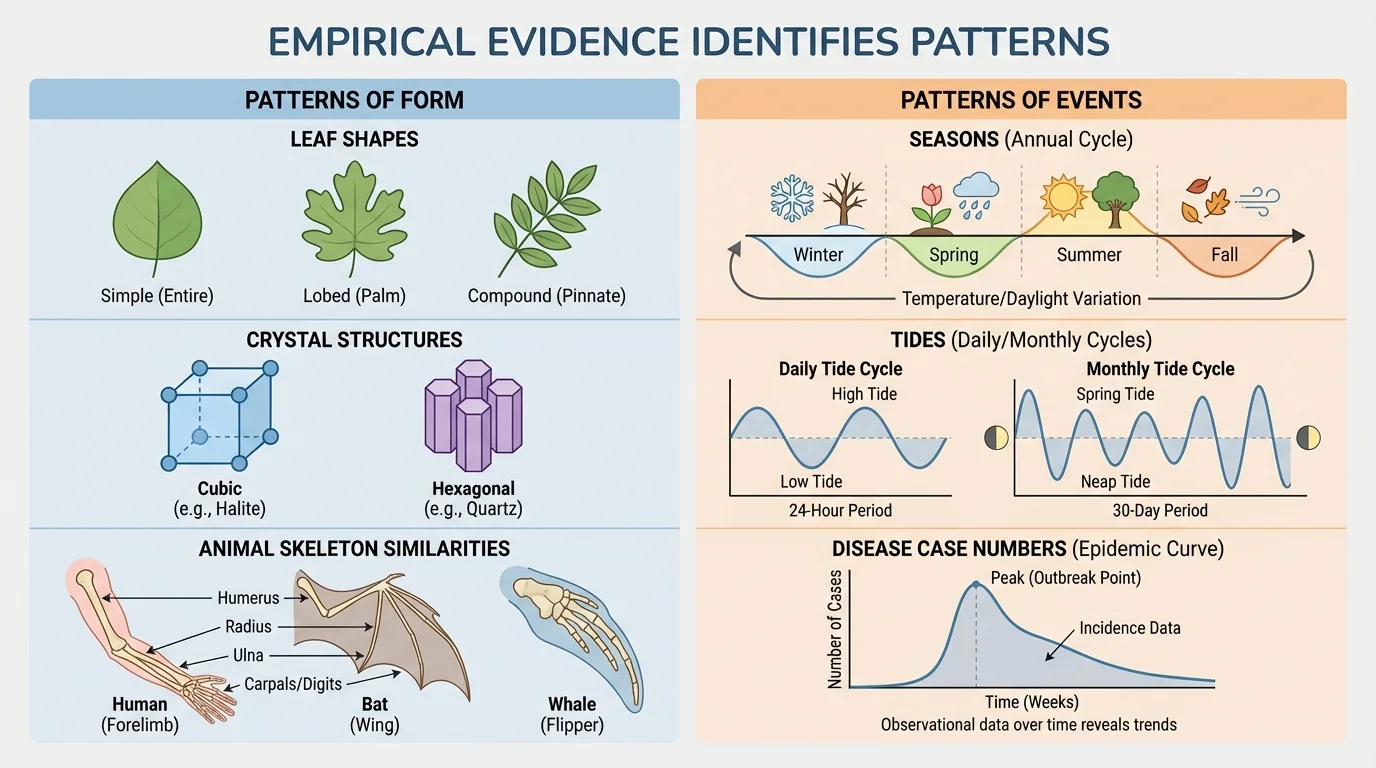
Science begins with noticing regularity. A pattern is a repeated form, trend, arrangement, or relationship. Some patterns involve forms, such as the spiral arrangement of sunflower seeds or the way elements in the periodic table can be grouped by similar properties. Other patterns involve events, such as tides rising and falling, infection rates increasing after exposure, or temperatures changing through the seasons.
Patterns help people organize and classify what they observe. If several minerals share hardness, crystal shape, and chemical composition, scientists can place them into categories. If several stars show similar brightness changes over time, astronomers can classify them into types. Classification is not just filing things into boxes. It is a way of recognizing structure in nature.
Observed patterns also lead to deeper questions, as [Figure 1] shows by comparing patterns of form with patterns of events. Once scientists notice that two things occur together, repeat in a sequence, or share similar structures, they ask what relationship links them and which factors influence that relationship.
For example, if students in a school seem to become sick after drinking from one fountain, that pattern prompts questions about water quality. If plants growing near a window bend in one direction, that pattern prompts questions about light. A pattern is often the first clue that there is an underlying cause worth investigating.
Empirical evidence is information gained through direct observation, measurement, testing, or experiment. It is based on what can be detected in the world rather than on guesswork, tradition, or personal belief alone.
Classification is the process of grouping objects, organisms, or events based on shared features. Relationship in science means a connection between variables, conditions, or characteristics that can be examined with evidence.
Without empirical evidence, people may still believe they have found a pattern, but they cannot show that the pattern is real. A few striking examples, a vivid memory, or a story from one person can feel convincing while still being unreliable.
Empirical evidence comes from the senses, often strengthened by tools. Thermometers, microscopes, telescopes, satellites, pH meters, particle detectors, and computer sensors all help scientists gather evidence more accurately than unaided human observation alone.
Evidence becomes more useful when it is measured, recorded, and repeatable. If one chemistry student says a solution "seems warmer," that is weak evidence. If several students measure the temperature and record a rise from \(22 \textrm{ °C}\) to \(35 \textrm{ °C}\), that is much stronger evidence. The numbers make the pattern clearer and easier to compare.
An anecdote is not the same as evidence. Suppose one athlete drinks a certain sports drink and performs well. That does not prove the drink improves performance. To identify a pattern, researchers would need data from many athletes, controlled conditions, and repeated trials. A real pattern must survive careful checking.
Humans are so tuned to detect patterns that we sometimes see them where none exist, such as faces in clouds or lucky streaks in random outcomes. This ability is useful for survival, but in science it must be tested against evidence.
Scientific evidence is also strongest when other investigators can collect similar results. If repeated measurements under similar conditions keep producing comparable outcomes, confidence in the pattern grows. If the results disappear when someone else checks, the original "pattern" may have been an error.
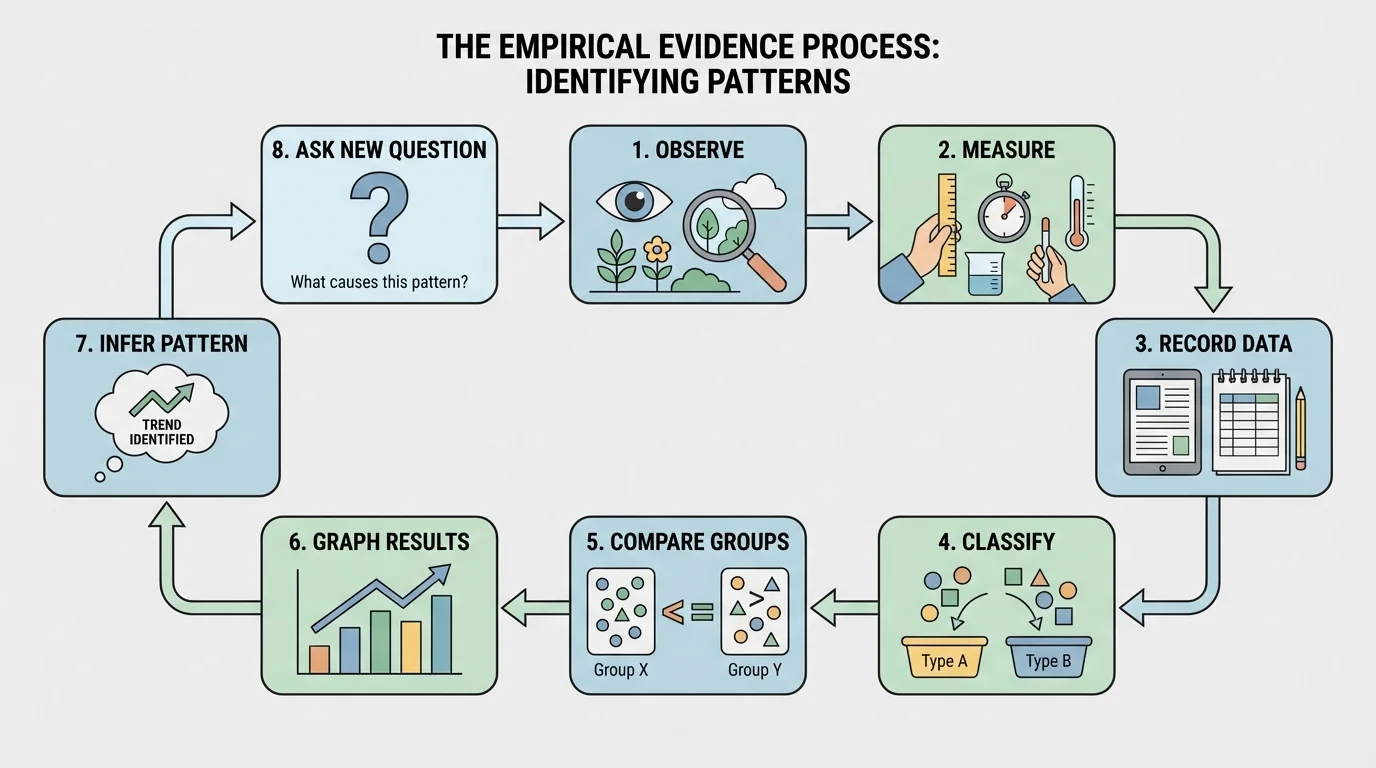
Scientists do not simply stare at the world and wait for truth to appear. They use a methodical process, and [Figure 2] illustrates how raw observations are turned into a supported pattern through measuring, classifying, comparing, and graphing.
The first step is careful observation. This may involve describing shapes, noting colors, timing events, counting organisms, or measuring quantities such as mass, distance, temperature, or concentration. Good observations are specific. "The plant grew" is vague; "the plant grew \(4 \textrm{ cm}\) in \(7\) days" is much better.
The second step is collecting enough data. A sample size of one is rarely enough to identify a dependable pattern. If ten batteries from the same brand last around the same amount of time, that suggests a trend. If only one battery is tested, it may just be unusually strong or weak. More data reduce the chance that random variation is mistaken for a pattern.
The third step is organization. Scientists often place observations into tables, categories, and graphs. A graph can reveal a trend that is hard to notice in a list of numbers. If the population of algae increases as nitrate concentration rises, plotting those values may show a clear upward pattern.
The fourth step is comparison. Scientists compare groups or conditions to see whether a pattern is linked to a particular factor. In an experiment on plant growth, one group might receive light and another might be kept in darkness. If the light-grown plants consistently show greater height, that pattern suggests light matters.
The fifth step is repetition. A single result may be caused by chance, a flawed instrument, or an unnoticed condition. Repeated trials help determine whether the pattern is stable. When a pattern repeats, confidence increases that it reflects something real about nature.
Patterns guide classification and raise questions
When scientists notice recurring features, they use them to sort and name things. But classification is only the beginning. The more important scientific move is asking why the pattern exists. Similar bone structures in different vertebrates, for example, support classification, but they also raise questions about function, ancestry, and adaptation.
This is why patterns are so central to science. They are not only labels. They are clues to mechanisms.
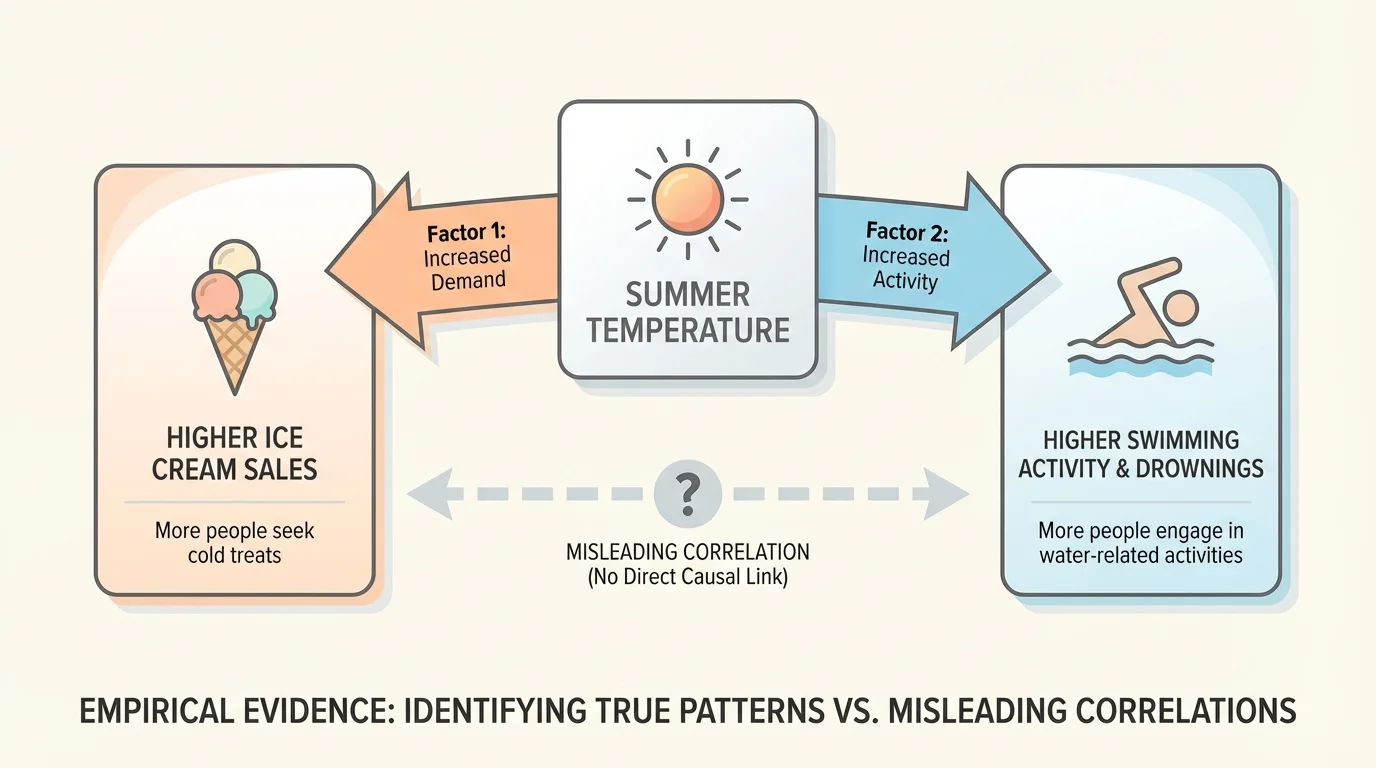
Not every apparent regularity is a reliable pattern. Some are caused by coincidence, incomplete data, or hidden influences, as [Figure 3] makes clear in a classic example of two trends that rise together for a different reason.
One major problem is correlation. Correlation means two variables change together. If one variable rises when another rises, or one falls when the other falls, there may be a correlation. But correlation does not automatically mean one variable causes the other.
For example, ice cream sales and drownings may both increase in summer. That does not mean buying ice cream causes drowning. A third factor—hot weather—affects both. This hidden influence is sometimes called a confounding variable.
Another problem is selection bias. If you only look at the data that support your expectation and ignore the rest, you may invent a pattern that is not truly there. Suppose someone claims that a coin is "lucky" because it landed heads three times in a row, but they ignore the next ten tosses. That is not sound evidence.
There is also random variation. In small samples, unusual outcomes happen frequently. If two students both score poorly on one test after eating breakfast, that does not prove breakfast lowers test performance. A large sample might show the opposite pattern.
Scientists therefore ask hard questions: How much data do we have? Was the sample fair? Were the measurements accurate? Could another variable explain the trend? These questions protect science from false conclusions.
When studying experiments, remember that a variable is any factor that can change. An independent variable is the factor being changed on purpose, and a dependent variable is what is measured in response.
Careful control of variables is one of the best ways to test whether an observed pattern reflects a true relationship.
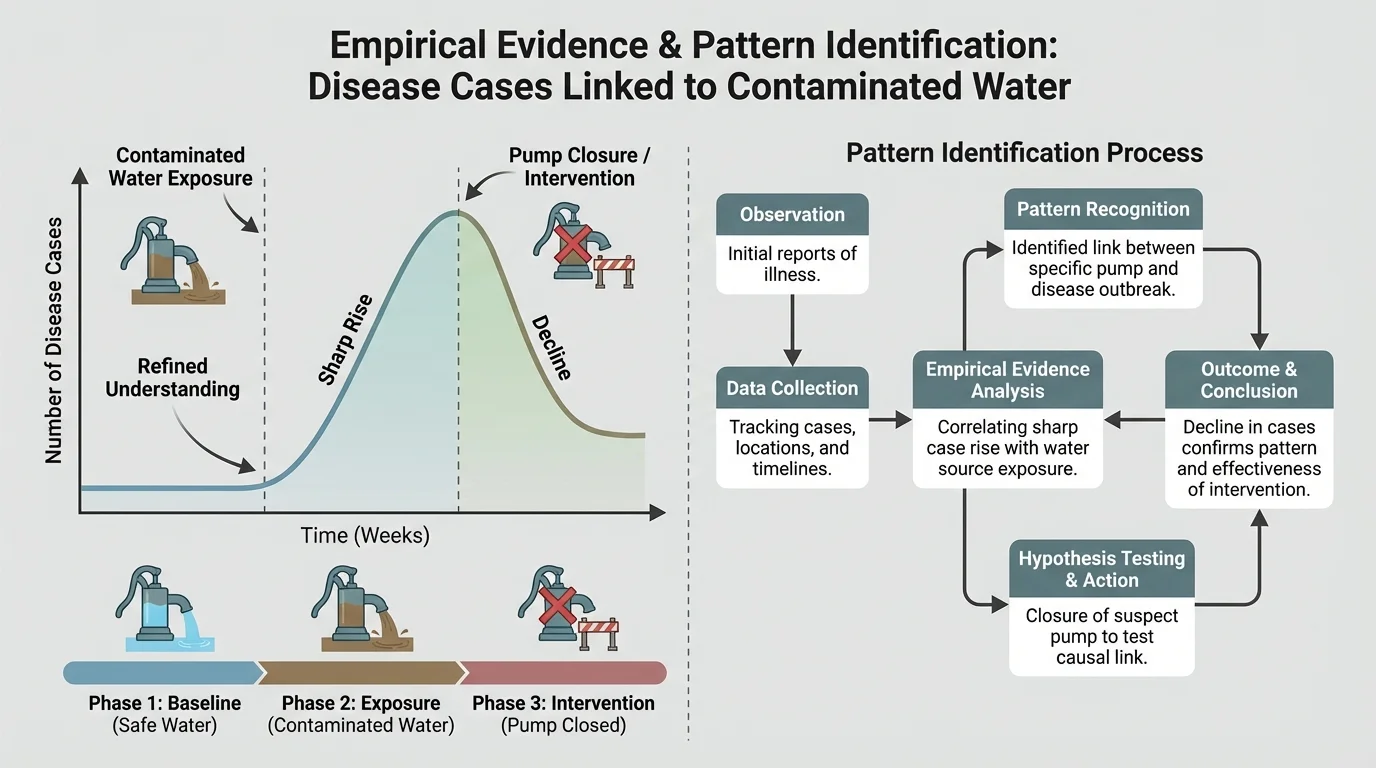
Evidence-based pattern recognition appears across every science. In epidemiology, the study of disease in populations, investigators look for where and when illnesses occur. A sudden cluster of cases in one neighborhood may reveal exposure to contaminated water, as [Figure 4] shows through a rise in cases followed by a decline after intervention. That pattern is not identified by rumor; it is identified by dates, locations, patient histories, and repeated records.
When John Snow investigated a cholera outbreak in London in the nineteenth century, he mapped deaths and noticed they clustered near a public water pump. The pattern in the data suggested a source of contamination. The key point was not that he had a clever idea; it was that he had empirical evidence connecting many separate cases.
In astronomy, scientists identify patterns in the motion of planets, the spectra of stars, and the brightness of distant objects. Repeated observations of planetary motion led to laws describing orbits. Spectral lines form patterns that help classify stars and determine which elements are present in them.
In chemistry, patterns in atomic structure and reactivity support the periodic table. Elements in the same column often have similar chemical behavior because they share patterns in their outer electrons. Sodium reacts vigorously with water, and potassium behaves similarly, though often more strongly. These are not random similarities; they are evidence-based patterns in structure and behavior.
Chemical reactions also reveal patterns when measurements are made carefully. In the reaction \[2\textrm{H}_2 + \textrm{O}_2 \rightarrow 2\textrm{H}_2\textrm{O}\] the ratio of particles is not guessed. It comes from repeated evidence about conservation of atoms and measurable reaction outcomes.
In ecology, scientists may count bird species in different habitats and notice that biodiversity drops when forests are fragmented. That pattern can then be tested against factors such as habitat size, food availability, and human disturbance. As with the disease example in [Figure 4], the pattern becomes meaningful because it is based on consistent records rather than isolated impressions.
In climate science, long-term temperature, rainfall, ice-core, and atmospheric \(\textrm{CO}_2\) records reveal patterns across decades and centuries. A hot day proves little. A persistent trend across many places and many years is much stronger evidence.
Example: Identifying a temperature trend
A town records average July temperatures over five years: \(28.1\), \(28.4\), \(28.8\), \(29.0\), and \(29.3 \textrm{ °C}\).
Step 1: Look at the sequence.
Each year is warmer than the previous year.
Step 2: Calculate the total increase.
The change is \(29.3 - 28.1 = 1.2 \textrm{ °C}\).
Step 3: Interpret cautiously.
This suggests an upward pattern in July temperature for this town over these five years, but scientists would still want longer records and data from other places before making a broader climate conclusion.
This example shows an important scientific habit: evidence can reveal a local pattern, but wider claims require wider evidence.
A pattern alone is not a final answer. It is often the beginning of a hypothesis, which is a testable proposed explanation. If repeated observations show that plants near light bend toward it, a scientist might hypothesize that growth hormones are redistributed in response to light.
Scientists then test the hypothesis. If evidence supports it, they may build a model that explains how the process works. If evidence does not support it, the hypothesis is revised or rejected. This is how science moves from description to explanation.
Patterns also allow prediction. If every tested metal expands when heated, a scientist can predict that another metal will probably expand under similar conditions. If a graph shows a regular relationship between force and extension in a spring for small stretches, researchers can use that pattern to estimate future behavior within that range.
"The first step in the scientific method is to notice something interesting."
— often attributed to scientists and science educators in various forms
Noticing is only the first step, but it is an essential one. The power of science comes from moving beyond noticing to testing.
In medicine, doctors look for patterns in symptoms, blood tests, scans, and patient histories. A single symptom may fit many conditions, but a cluster of evidence can reveal a diagnosis. Public health officials track patterns in infection rates to decide where vaccines, clean water systems, or health warnings are most needed.
In engineering, pattern detection helps identify material failure before disaster occurs. Repeated small cracks in a bridge component, unusual vibration frequencies in a turbine, or rising temperatures in an electrical system may signal a developing problem. Sensors collect empirical evidence so action can be taken before a breakdown happens.
In economics and social science, researchers examine patterns in employment, prices, spending, and migration. But they must still be careful about correlation and confounding variables. If one city has higher test scores and higher household income, the relationship may involve school funding, nutrition, housing, stress, and many other factors.
Technology companies use pattern recognition in facial recognition systems, recommendation algorithms, and fraud detection. Yet even advanced systems depend on data quality. If the training data are biased or incomplete, the pattern the system learns may be misleading or unfair. Evidence matters not only in science labs but also in the digital systems that shape daily life.
Modern telescopes and satellites collect such huge amounts of data that computers are often used to detect patterns humans would miss at first glance. Even then, scientists must verify that the computer-identified pattern reflects reality rather than noise in the data.
This is an important lesson for the age of artificial intelligence: finding a pattern is not enough. We must still ask whether the evidence is representative, accurate, and interpreted correctly.
Scientific knowledge grows stronger with evidence, but it also stays open to revision. Sometimes a pattern seems clear at first and then changes when more data arrive. For example, a species once thought to belong to one group may be reclassified after genetic evidence shows a different relationship.
Classification systems themselves improve over time. Early systems often grouped organisms by visible similarity alone. Modern biology still values visible form, but it also compares DNA, development, and biochemistry. The pattern becomes more accurate when the evidence becomes richer.
Uncertainty is not a weakness in science. It is honesty about the limits of current evidence. Scientists can say, "The evidence strongly suggests this pattern," while still being ready to update that conclusion if better measurements appear.
That willingness to revise is one reason science is powerful. It does not depend on authority or confidence alone. It depends on how well ideas match the evidence.
When students learn that empirical evidence is needed to identify patterns, they are learning one of the deepest habits of scientific thinking. Observed patterns guide organization and classification, and they prompt questions about relationships and the factors that influence them. But those patterns become meaningful only when they are grounded in careful observation, reliable measurement, repeated testing, and critical reasoning.