Two phones can look almost identical, yet one is easier to repair, uses less energy, costs more to make, and lasts twice as long. Which one is the better design? The answer is not obvious because real-world design is rarely about finding a single "perfect" solution. It is about weighing evidence, applying science, and making the strongest possible argument for one choice over another.
Every engineered product, system, or process represents a set of decisions. Cities choose between solar panels and natural gas plants. Hospitals compare materials for medical tools. Schools consider whether to replace diesel buses with electric buses. In each case, people must evaluate design solutions that compete with one another.
A design solution is a plan, product, or process created to solve a problem. But solving the problem is only the beginning. A bridge must be strong, affordable, safe, and durable. A water bottle must hold liquid, but it might also need to be cheap, reusable, lightweight, and environmentally responsible. Better design evaluation means asking not only, "Does it work?" but also, "How well does it work, for whom, at what cost, and with what consequences?"
Criteria are the standards used to judge whether a design is successful, such as safety, efficiency, durability, or cost.
Constraints are the limits a design must work within, such as budget, available materials, laws, space, or time.
Trade-off is the acceptance of one disadvantage in order to gain one advantage. In design, improving one feature often affects another.
Design evaluation matters because resources are limited and the effects of design decisions can be huge. A cheaper product may break faster. A very efficient machine may require rare materials. A low-emission transportation system may still be inaccessible to people with disabilities if it is poorly planned. Good decisions come from comparing many relevant factors rather than focusing on only one.
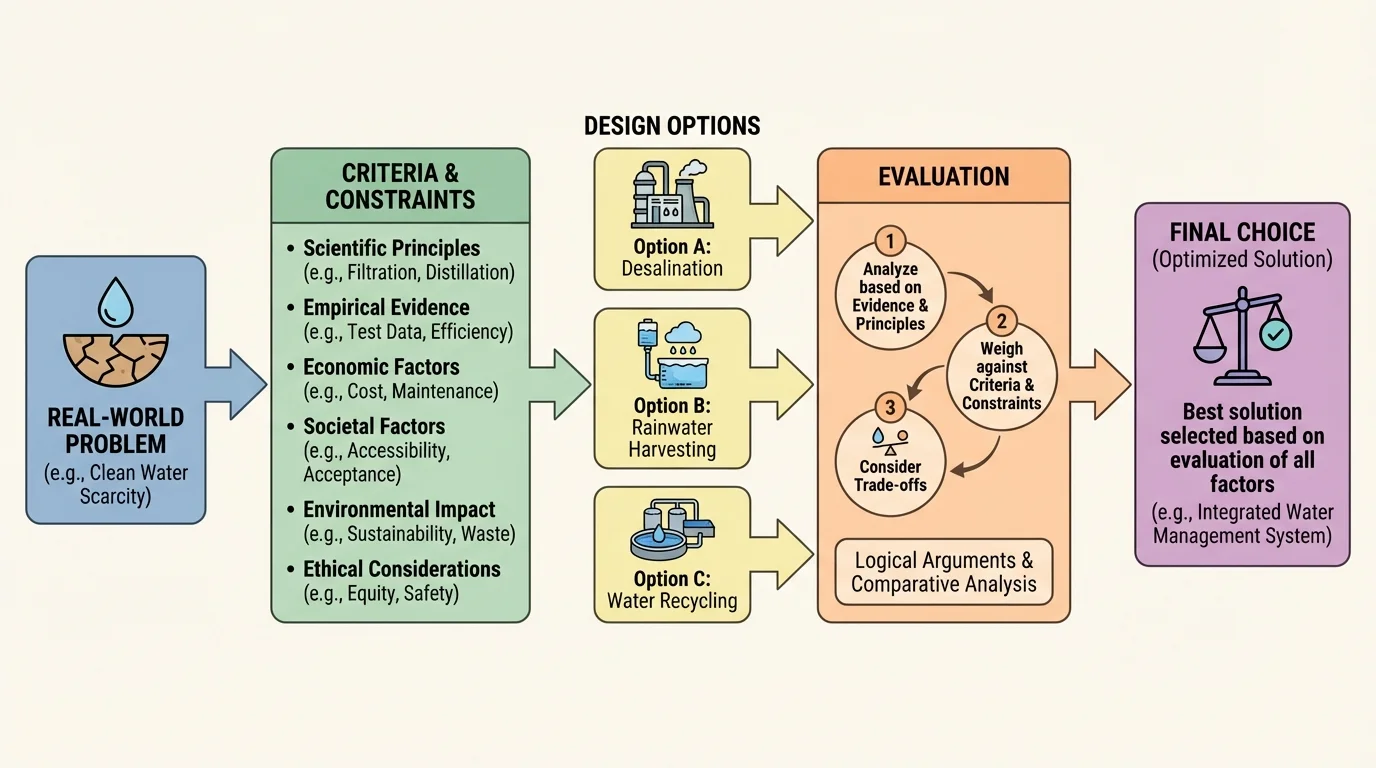
When engineers and scientists evaluate options, they begin with a clearly defined problem and then compare several possible responses, as [Figure 1] shows. The process includes identifying what success looks like, what limits exist, and what evidence will be used to judge the options.
A real-world problem might be stated this way: a school wants to reduce transportation emissions without making student travel unsafe or unaffordable. Several designs could address that problem: keep diesel buses, buy electric buses, add protected bike lanes, or combine public transit with walking programs. Each of those is a possible solution, but none can be judged fairly unless the same criteria are applied to all of them.
A useful evaluation also recognizes optimization. Optimization means improving a design to best meet the chosen criteria under the given constraints. This does not always mean maximizing one feature. For example, maximizing speed at all costs may reduce safety. In many real systems, the best design is the one that balances multiple needs.
That is why trade-offs are central. A reusable glass bottle may reduce waste but weigh more than plastic. A solar-powered streetlight may cut fuel use but cost more to install. The challenge is not to avoid trade-offs; it is to identify them honestly and decide which ones are acceptable.
Design evaluation is not based on opinion alone. It depends on scientific understanding. Different kinds of problems rely on different scientific principles. A vehicle design uses physics concepts such as force, friction, energy transfer, and efficiency. A water filter involves chemistry, including solubility, reactions, and contamination. A composting system uses biology because decomposition depends on microorganisms, oxygen, temperature, and moisture.
Suppose a student team compares two home insulation materials. One reduces heat transfer better than the other. That claim should connect to thermal energy principles. If less heat escapes, the building needs less energy for heating or cooling. The rate of energy transfer can be thought of as linked to temperature difference and material properties. Even without advanced equations, students can reason scientifically: if a material resists thermal transfer more effectively, indoor temperatures remain more stable and energy use can decrease.
Sometimes formulas help clarify comparisons. If a device uses electrical power, energy consumption can be estimated with \(E = Pt\), where \(E\) is energy, \(P\) is power, and \(t\) is time. If one light bulb uses \(10 \textrm{ W}\) for \(5 \textrm{ h}\), then \(E = 10 \times 5 = 50 \textrm{ Wh}\). If another uses \(6 \textrm{ W}\) for the same time, then \(E = 6 \times 5 = 30 \textrm{ Wh}\). The lower-energy bulb may be a better design choice if brightness and lifespan are also acceptable.
Scientific principles guide evaluation
Scientific ideas explain why a design performs the way it does. Evidence such as test data becomes stronger when it is connected to principles like conservation of energy, material strength, chemical stability, ecosystem impact, or human physiology. A convincing evaluation always links measurements to scientific causes.
Environmental science often enters design decisions too. If a factory chooses between materials, it should consider emissions, toxicity, energy use in manufacturing, and waste at the end of the product's life. A material that performs well during use may still be a poor choice if life-cycle analysis shows that its production creates high carbon emissions or persistent pollution.
For example, burning fuels containing carbon releases greenhouse gases such as \(\textrm{CO}_2\), which increase a carbon footprint. If one transportation design emits less \(\textrm{CO}_2\) per passenger-kilometer, that is relevant evidence in environmental evaluation. Scientific principles about combustion, energy conversion, and atmospheric effects help explain why that difference matters.
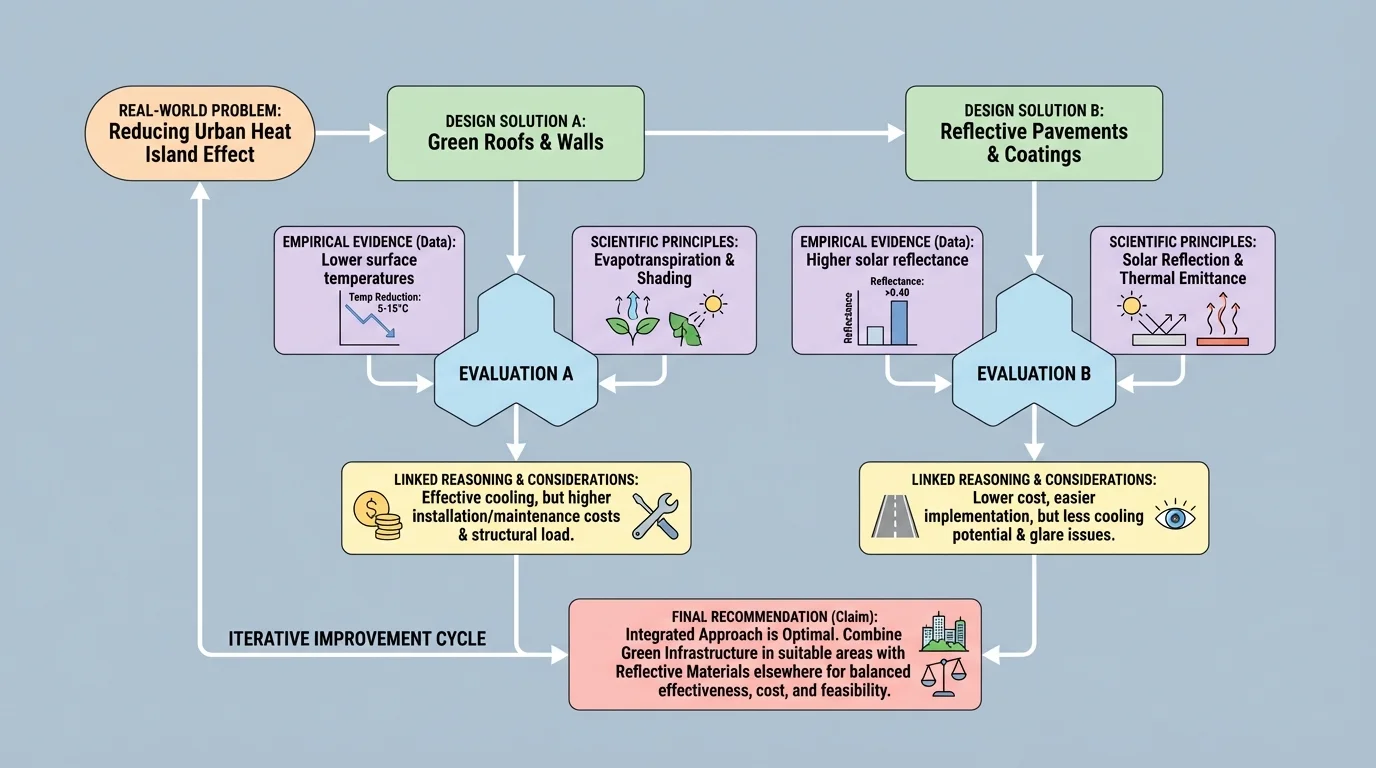
Evaluating designs requires more than listing facts. It requires argument from evidence, a scientific practice in which a person makes a claim, supports it with reliable data, and explains why the data justify the claim. This structure is often described as claim-evidence-reasoning, or CER, as [Figure 2] illustrates.
A claim states which solution is better for a particular purpose. Evidence includes measurements, observations, test results, cost data, surveys, or research findings. Reasoning connects the evidence to scientific principles and shows why the claim makes sense.
For instance, a claim might be: "Electric buses are a better long-term transportation design for the school district than diesel buses." Evidence could include lower emissions per kilometer, reduced maintenance, and quieter operation. Reasoning would connect those data to principles of electric motor efficiency, air pollution effects on health, and total cost over time. Strong reasoning also acknowledges limits: electric buses may require expensive charging infrastructure and depend on the local electricity source.
A high-quality argument also considers counterclaims. Someone may argue that diesel buses are cheaper at the start. That point matters. Ignoring it weakens the argument. Responding to it strengthens the evaluation: although diesel buses have lower initial cost, they may produce higher fuel and health-related costs later. The goal is not to "win" by ignoring the other side; it is to build the most logically complete conclusion.
Evidence must also be trustworthy. One isolated test is weaker than repeated measurements. A company advertisement is usually less reliable than independent studies. Data collected under different conditions may not be directly comparable. If one battery test was done at \(20^\circ \textrm{C}\) and another at \(0^\circ \textrm{C}\), performance differences may reflect temperature rather than design quality.
Some of the most expensive engineering failures happened not because no one had data, but because decision-makers ignored inconvenient evidence. Good design evaluation depends as much on honest reasoning as on technical skill.
As seen earlier in [Figure 1], the evaluation process begins before the final choice is made. The argument becomes stronger when criteria and constraints are identified first, because then the evidence can be matched to the actual problem rather than to personal preference.
Real-world design choices usually involve more than technical performance. Four especially important categories are economic, societal, environmental, and ethical factors. These do not replace scientific evidence; they expand what counts as relevant evidence.
Economic factors include initial cost, operating cost, maintenance, repair, replacement, and possible savings over time. A cheap product is not always economical if it fails quickly. For example, if Device A costs $100 and lasts \(2\) years, while Device B costs $180 and lasts \(6\) years, Device B may be more cost-effective. The yearly cost comparison is \(100 \div 2 = 50\), so Device A costs about $50 per year, while Device B costs \(180 \div 6 = 30\), or about $30 per year.
Societal factors include accessibility, public acceptance, health, safety, convenience, and effects on different groups. A new transit system may reduce traffic but still fail if it does not serve neighborhoods equitably. A water-saving shower design may conserve resources but be rejected if users find it uncomfortable or unreliable.
Environmental factors include resource use, pollution, habitat effects, waste generation, and climate impact across the product's life. A design can be efficient during use but damaging during extraction or disposal. This is why sustainability means more than "green marketing." It involves meeting present needs without causing unacceptable future harm.
Ethical considerations ask whether a design is fair, responsible, and respectful of human well-being. Were workers exposed to unsafe conditions to make the product? Are users being misled about performance? Does an algorithm used in a medical or hiring system treat groups unfairly? Ethics matters because a design can be technically successful and still be wrong.
| Factor | Questions to Ask | Possible Evidence |
|---|---|---|
| Economic | What does it cost now and later? | Purchase price, repair data, energy bills |
| Societal | Who benefits or is burdened? | Surveys, safety records, access maps |
| Environmental | What are the effects on air, water, land, and climate? | Emission data, waste totals, material sourcing |
| Ethical | Is the design fair and responsible? | Labor reports, bias testing, transparency records |
Table 1. Major categories of factors used to evaluate competing design solutions.
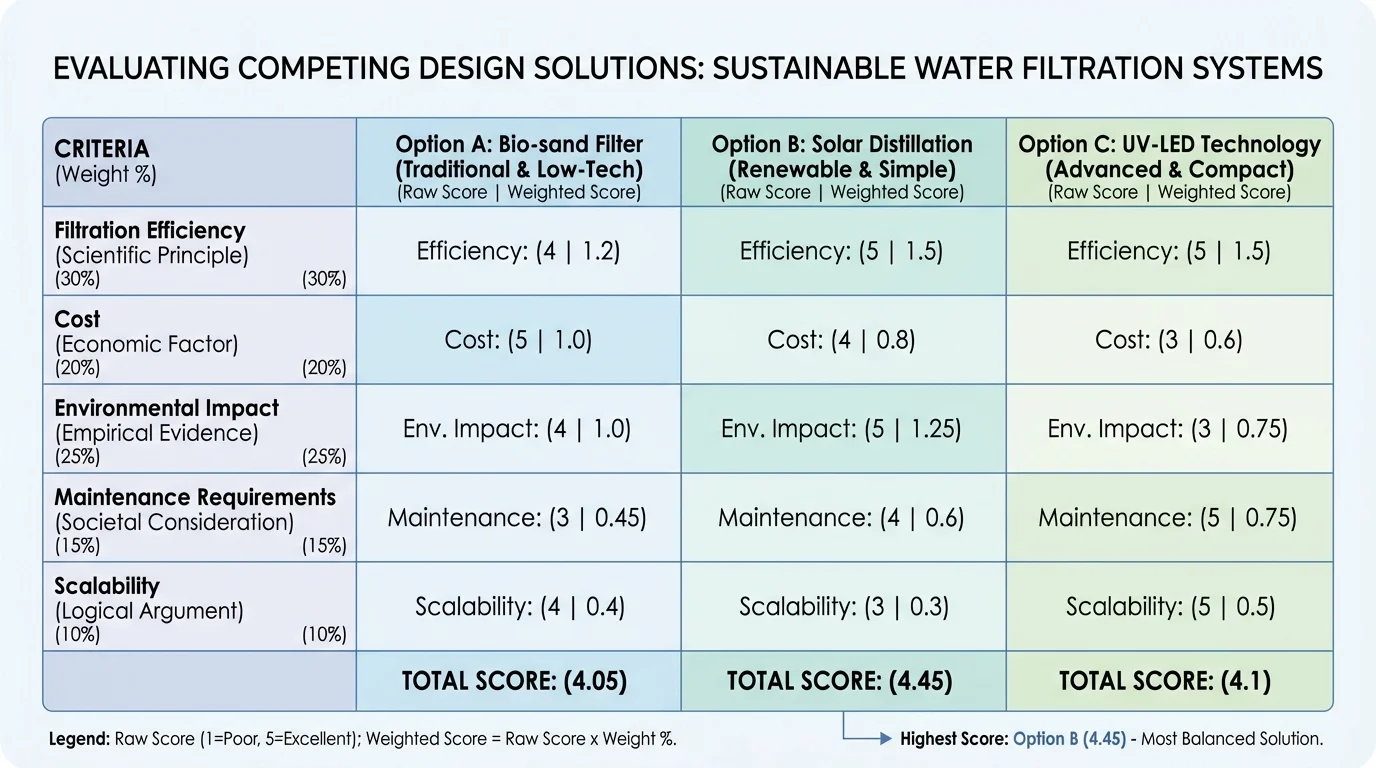
[Figure 3] When many factors matter at once, a decision matrix helps organize the comparison. A decision matrix lists criteria, assigns each criterion a weight based on importance, scores each design, and then calculates totals.
This method does not make the decision automatically. People still choose the criteria and weights, and those choices can be debated. But the matrix makes the reasoning visible. Instead of saying "I just think option A is better," a student can say, "Option A scored higher because safety and long-term operating cost were weighted most heavily."
Suppose a town compares three streetlight designs: traditional bulbs, LED bulbs, and solar-powered LED units. The town chooses four criteria: cost, energy efficiency, maintenance, and environmental impact. If the weights are \(4\), \(5\), \(3\), and \(4\), then energy efficiency matters most.
Worked example: weighted comparison
Three designs are scored on a scale from \(1\) to \(5\), where \(5\) is best.
Step 1: Set weights
Cost \(= 4\), efficiency \(= 5\), maintenance \(= 3\), environmental impact \(= 4\).
Step 2: Score the options
Traditional: \(2, 1, 2, 1\)
LED: \(4, 5, 4, 4\)
Solar LED: \(2, 5, 3, 5\)
Step 3: Multiply each score by its weight
Traditional total: \(2\cdot 4 + 1\cdot 5 + 2\cdot 3 + 1\cdot 4 = 8 + 5 + 6 + 4 = 23\)
LED total: \(4\cdot 4 + 5\cdot 5 + 4\cdot 3 + 4\cdot 4 = 16 + 25 + 12 + 16 = 69\)
Solar LED total: \(2\cdot 4 + 5\cdot 5 + 3\cdot 3 + 5\cdot 4 = 8 + 25 + 9 + 20 = 62\)
The LED design ranks highest in this matrix. However, if environmental impact were weighted even more heavily, the solar LED design might become the top choice. That is why the weighting itself must be justified with evidence and community priorities.
The matrix in [Figure 3] is useful because it reveals not only which design scores highest, but also why. It can also show where more data are needed. If one score is uncertain, the final recommendation should mention that uncertainty rather than pretending the comparison is perfectly precise.
[Figure 4] A school district wants to reduce transportation emissions, maintain student safety, and stay within budget. This single problem can lead to different proposals: keep diesel buses, replace them with electric buses, or invest more in biking and public transit access.
Diesel buses already exist in many districts, so they may require less immediate spending. They can travel long distances and refuel quickly. However, they produce tailpipe emissions, including \(\textrm{CO}_2\) and other pollutants, and they rely on fossil fuels.
Electric buses often cost more upfront but can have lower operating and maintenance costs because electric motors have fewer moving parts. They produce no tailpipe emissions, which can improve local air quality around schools. Their total climate benefit depends partly on how electricity is generated. If the grid relies heavily on coal or gas, the emissions advantage may be smaller than expected.
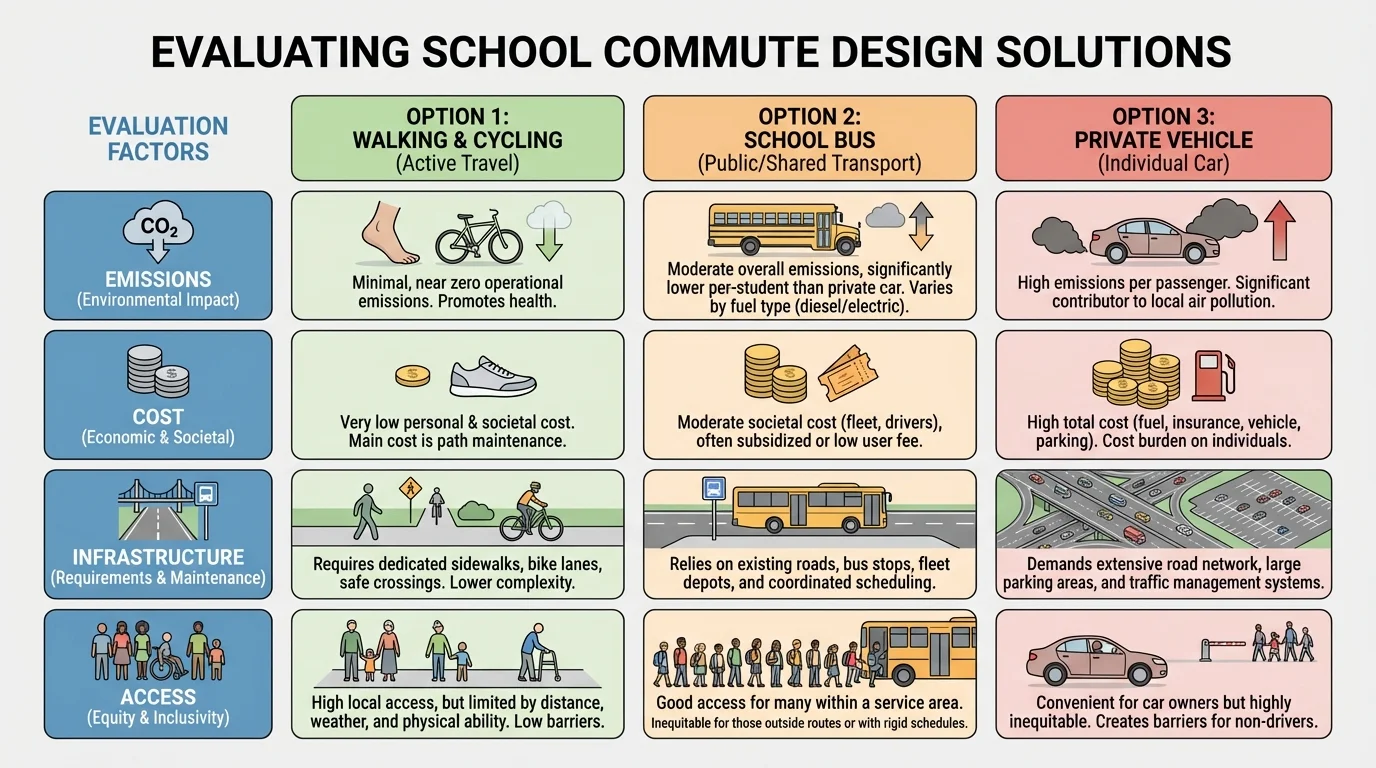
Biking and public transit expansion may reduce emissions significantly and improve health through physical activity. But this option depends on safe infrastructure, weather, distance from school, and equal access. Students living far away or in unsafe traffic conditions may not benefit equally.
An evidence-based argument would compare data such as cost per year, emissions per student, accident risk, infrastructure needs, and accessibility. It might conclude that electric buses are the best primary option while biking and transit improvements should be added where safe and practical. That kind of answer is often stronger than choosing only one solution for every situation.
Case analysis
A district estimates the following yearly values for one route:
Step 1: Compare operating costs
Diesel route cost: $18,000 per year
Electric route cost: $11,000 per year
The yearly savings are \(\$7{,}000\).
Step 2: Compare emissions
Diesel route emissions: \(14{,}000 \textrm{ kg}\) of \(\textrm{CO}_2\) per year
Electric route emissions from electricity generation: \(5{,}000 \textrm{ kg}\) of \(\textrm{CO}_2\) per year
The reduction is \(14{,}000 - 5{,}000 = 9{,}000 \textrm{ kg}\) of \(\textrm{CO}_2\) each year.
Step 3: Consider constraints
If charging infrastructure costs $140,000, then the district must ask how many years of savings are needed to recover that cost. Using operating savings alone, the payback time is \(140{,}000 \div 7{,}000 = 20\) years.
This does not automatically reject electric buses. It means the district should include grants, health benefits, and long-term climate goals in the evaluation before making a final recommendation.
The same logic applies to many community decisions. The best answer is often conditional: one option may be best under urban conditions, another in rural conditions. Scientific and social context matters.
Consider a simpler product: a water bottle. Choices might include single-use plastic, aluminum, glass, and reusable stainless steel. At first glance, this seems like an environmental question only, but it actually involves all major evaluation factors.
Single-use plastic bottles are light and cheap, which lowers transportation cost. But they create large amounts of waste and are often used only once. Glass is reusable and chemically stable, but it is heavier and more likely to break. Aluminum is light and recyclable, but production can use large amounts of energy. Stainless steel bottles last a long time and reduce repeated waste, though they cost more at purchase.
This is where empirical evidence matters. Instead of assuming which bottle is "best," a student should examine actual data: mass, durability tests, recycling rates, manufacturing energy, cost over repeated use, and consumer behavior. If a reusable bottle is only used twice, it may not outperform a simpler option. If it is used hundreds of times, the result changes.
Later, when students build recommendations, the structure shown in [Figure 2] still applies: claim, evidence, and reasoning. "Reusable stainless steel is the best option for frequent daily use" becomes convincing only if supported by durability, life-span, and waste-reduction evidence.
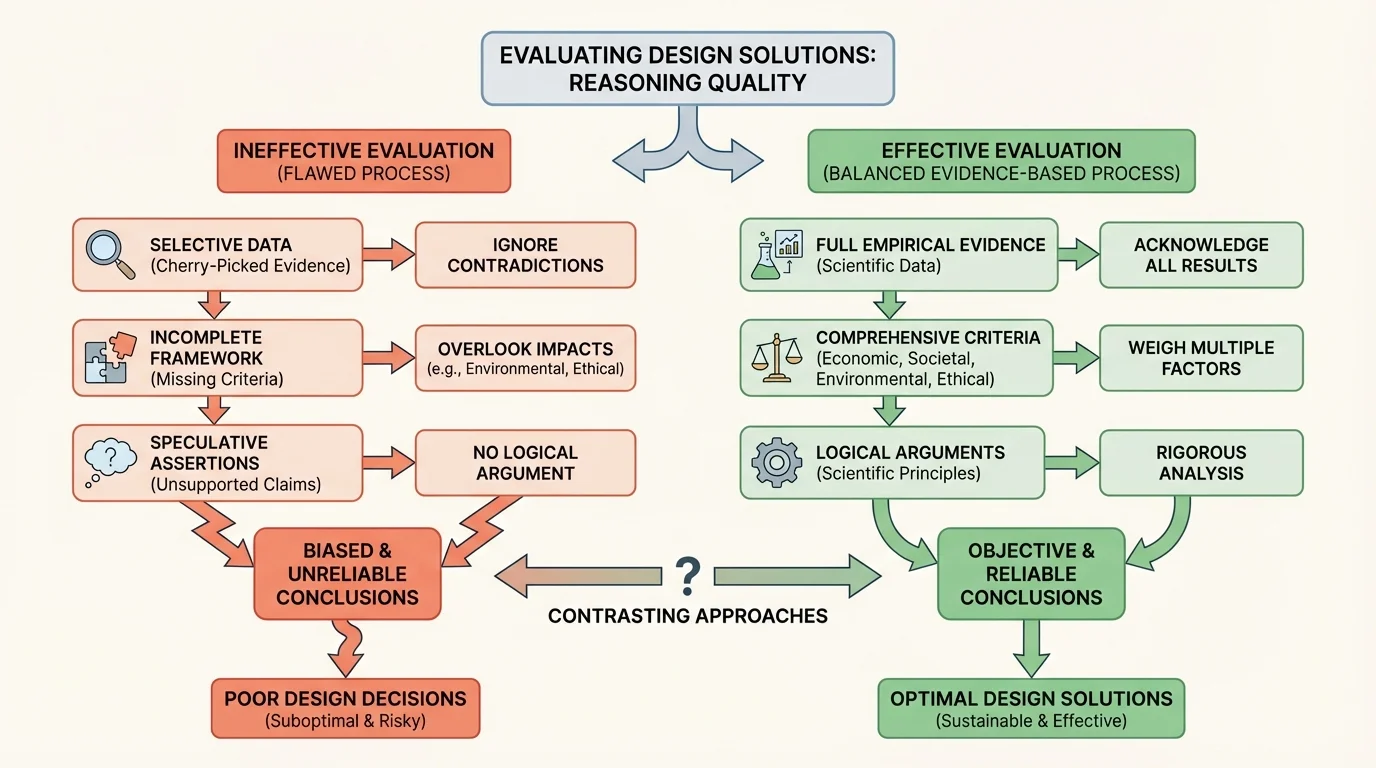
Not every design argument is strong. Some are persuasive-sounding but weak. Common problems include focusing on only one criterion, ignoring evidence that does not support the preferred solution, using unreliable sources, and confusing short-term benefit with long-term value. The contrast between weak and strong evaluation is clear in [Figure 5].
One major mistake is cherry-picking, which means selecting only evidence that supports one side. Another is presenting a false choice, as if there are only two options when hybrid solutions exist. A third is treating all criteria as equally important when they are not. In medical device design, safety may matter far more than appearance. In emergency shelter design, speed of construction may matter more than luxury.
Uncertainty should also be handled honestly. Sometimes evidence is incomplete. Maybe a material is new and long-term durability data are limited. A strong argument does not hide that weakness. It states it clearly: "Based on current tests, this design appears promising, but durability beyond \(5\) years is not yet well established."
Scientific reasoning from earlier science classes still applies here: observations lead to data, data support or challenge explanations, and conclusions must match the quality of the evidence. Better evidence leads to stronger design arguments.
As shown conceptually in [Figure 5], improving an argument often means broadening it, not just adding more words. Better arguments compare multiple criteria, address counterclaims, and explain the science behind the data.
The final step is making a recommendation. A recommendation should clearly name the preferred design, explain the conditions under which it is best, and justify the choice with evidence and reasoning. It should also note serious drawbacks and why they are acceptable or manageable.
A strong recommendation might sound like this: "The district should transition to electric buses for high-use routes because they lower yearly operating costs and reduce local air pollution, while continuing diesel use temporarily on routes where charging infrastructure is not yet available." That statement is much stronger than "Electric buses are better," because it reflects evidence, constraints, and context.
Design evaluation is therefore not just about technology. It is about judgment. It combines science, data, logic, and human values. When students learn to evaluate competing design solutions well, they are learning how informed societies make better choices about energy, transportation, health, materials, and the future.
"The best design is not the one with no weaknesses. It is the one whose strengths best match the problem while its weaknesses are understood and managed."