A city may seem like a place of streets, buildings, and people, but behind every city is geography. Why are so many large cities built near rivers, coasts, or flat plains? Why do some regions stay lightly populated for centuries while others become crowded centers of trade and culture? Geographers answer questions like these by studying patterns on maps. When you learn to read maps and geographic tools carefully, you are not just finding places. You are learning how land, water, climate, and human choices connect.
In the Eastern Hemisphere, these connections are especially clear. This half of the world includes all of Australia and large parts of Africa, Europe, and Asia. It contains the Sahara, the Himalayas, the Nile River, the Indian monsoon region, and some of the most densely populated places on Earth. By comparing different map types and other sources, geographers can investigate problems such as water shortages, flood risks, food production, transportation barriers, and where people are most vulnerable to natural hazards.
Geography is more than memorizing location names. It is the study of spatial patterns, or how things are arranged across Earth's surface. A pattern might show that people live close to rivers, that deserts usually have low population density, or that major ports grow where coastlines make trade easier. Once geographers notice patterns, they ask why those patterns exist and what they may lead to in the future.
Geographic tools help turn observations into evidence. A single map can tell part of the story, but several maps used together can reveal much more. For example, if a population map shows many people living in one area, a physical map and climate map may explain why. Perhaps the land is flat, the soil is fertile, and rainfall is dependable. Geography becomes a kind of investigation in which maps act like clues.
Geographic inference is a conclusion based on map evidence, data, and geographic knowledge. A prediction is an informed idea about what may happen in the future based on current geographic patterns.
When geographers study problems, they usually connect physical features and human systems. Physical features include landforms, rivers, climate, vegetation, and natural hazards. Human systems include settlements, agriculture, transportation, trade, language, religion, and migration. Most real-world geographic problems happen where these two parts interact.
Geographers use many kinds of maps. A physical map shows landforms such as mountains, plains, plateaus, and rivers. A political map shows boundaries, countries, and capitals. A climate map shows long-term weather patterns such as dry, tropical, or temperate zones. A population map shows where people live densely or sparsely. Resource maps show the location of oil, minerals, forests, or farmland.
Another important tool is the thematic map, which focuses on one topic. A thematic map might show rainfall, languages, disease spread, internet access, or earthquake risk. These maps are especially useful when studying patterns in human systems because they help geographers compare one kind of information across a region.
Geographers also use satellite images, aerial photographs, globes, atlases, graphs, charts, and digital databases. Modern technology includes GIS, or Geographic Information Systems. GIS allows geographers to layer information, such as roads, rivers, elevation, and population, on one digital map. This makes it easier to see connections that might be missed on separate paper maps.
Some of the most detailed maps used today are updated by satellites that observe Earth repeatedly. This means geographers can track changes such as shrinking lakes, growing cities, and forest loss over time.
Sources also matter. A map made by a government agency, scientific organization, or trusted research group is usually more reliable than a random image online. Good geographic thinking means checking the date, source, scale, and purpose of a map before using it to make conclusions.
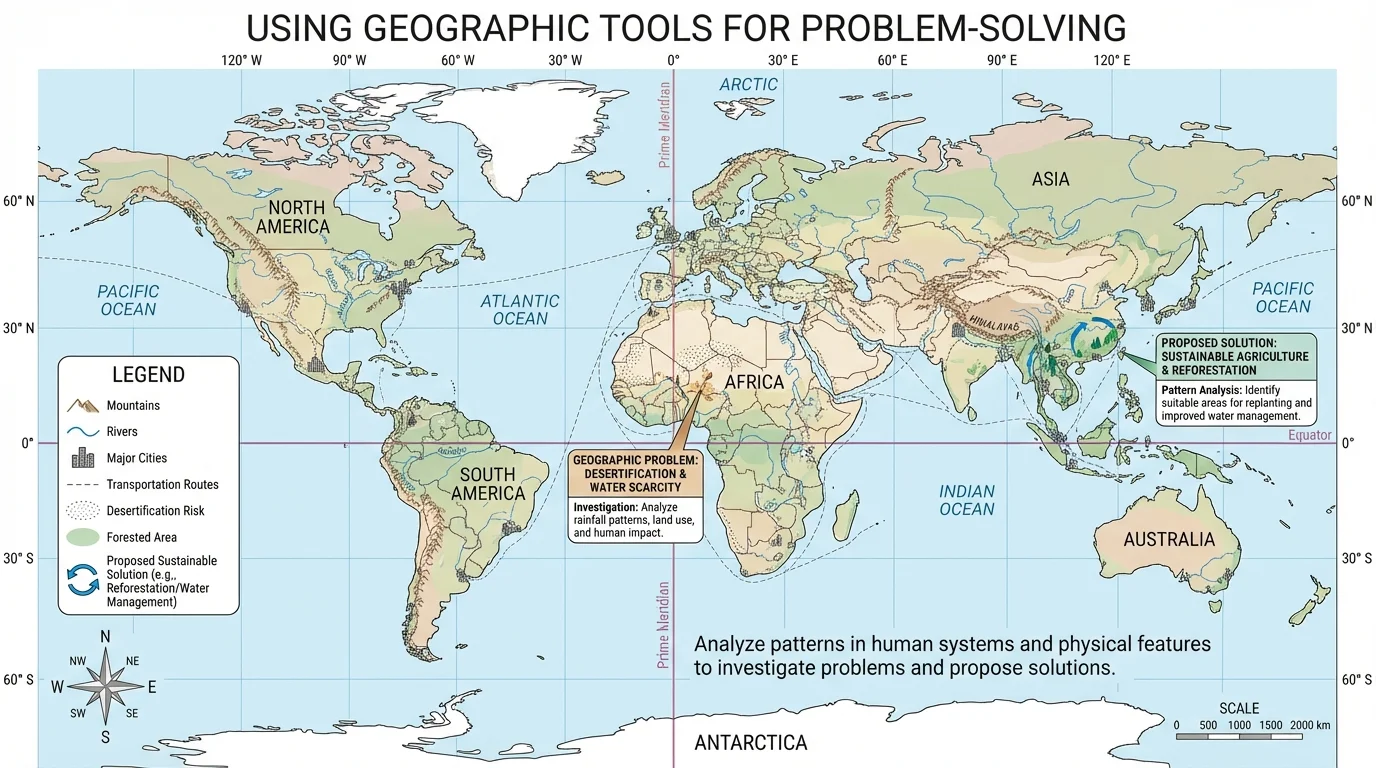
[Figure 1] Every map has parts that help readers understand it. A title tells what the map is about. A legend, also called a key, explains symbols and colors. A scale shows distance, and a compass rose shows direction. Latitude and longitude help geographers locate places precisely.
Latitude lines measure distance north or south of the Equator, while longitude lines measure distance east or west of the Prime Meridian. These lines form a grid that helps people compare places. If two cities lie at similar latitudes, they may have similar climate patterns, although elevation and nearby water can still make a difference.
Map projection also matters. Earth is round, but most maps are flat, so some size or shape is distorted. A region may look larger or smaller than it really is depending on the projection. That is why geographers do not rely on only one map when making careful judgments.
Scale can change what you notice. A large-scale map shows a smaller area in more detail, such as a city or river valley. A small-scale map shows a larger area with less detail, such as a continent. As seen earlier in [Figure 1], map elements help you avoid mistakes when comparing distance, direction, and location.
Physical geography often shapes where people can travel, farm, and build cities. Mountains can block movement and create climate differences. Rivers provide water and transportation. Deserts limit farming because water is scarce. Coastal plains often become centers of settlement because they connect inland resources with ocean trade.
Consider the Himalayas in Asia. These mountains form a major barrier between South Asia and the Tibetan Plateau. They affect transportation, settlement, and even weather by helping shape the monsoon system. In Africa, the Sahara Desert creates another major barrier. Its dryness limits dense settlement except near oases, rivers, and coasts.
River valleys are among the clearest examples of geographic patterns. The Nile Valley in northeastern Africa supports millions of people in an area that is otherwise mostly desert. The Ganges Plain in India and the North China Plain in eastern Asia are also densely populated because rivers bring water, fertile soil, and transportation routes.
Climate patterns matter too. Tropical regions may support dense farming if rainfall is reliable, while arid regions usually depend on irrigation. Cold northern regions such as Siberia have fewer people partly because long winters and frozen ground make farming and transportation harder. When geographers compare landform and climate maps, they often can predict where human settlement is likely to cluster.
Physical features influence opportunity and risk. A river can support farming and trade, but it can also flood. A coast can encourage port cities, but it can also expose people to storms or sea-level rise. Geographic problems rarely come from nature alone; they come from the way people live within natural systems.
This is why one physical feature can have both advantages and disadvantages. A fertile floodplain may attract millions of people, but that same concentration of people increases danger when floods occur. The pattern is not random. It is the result of people choosing useful places, even when those places carry risk.
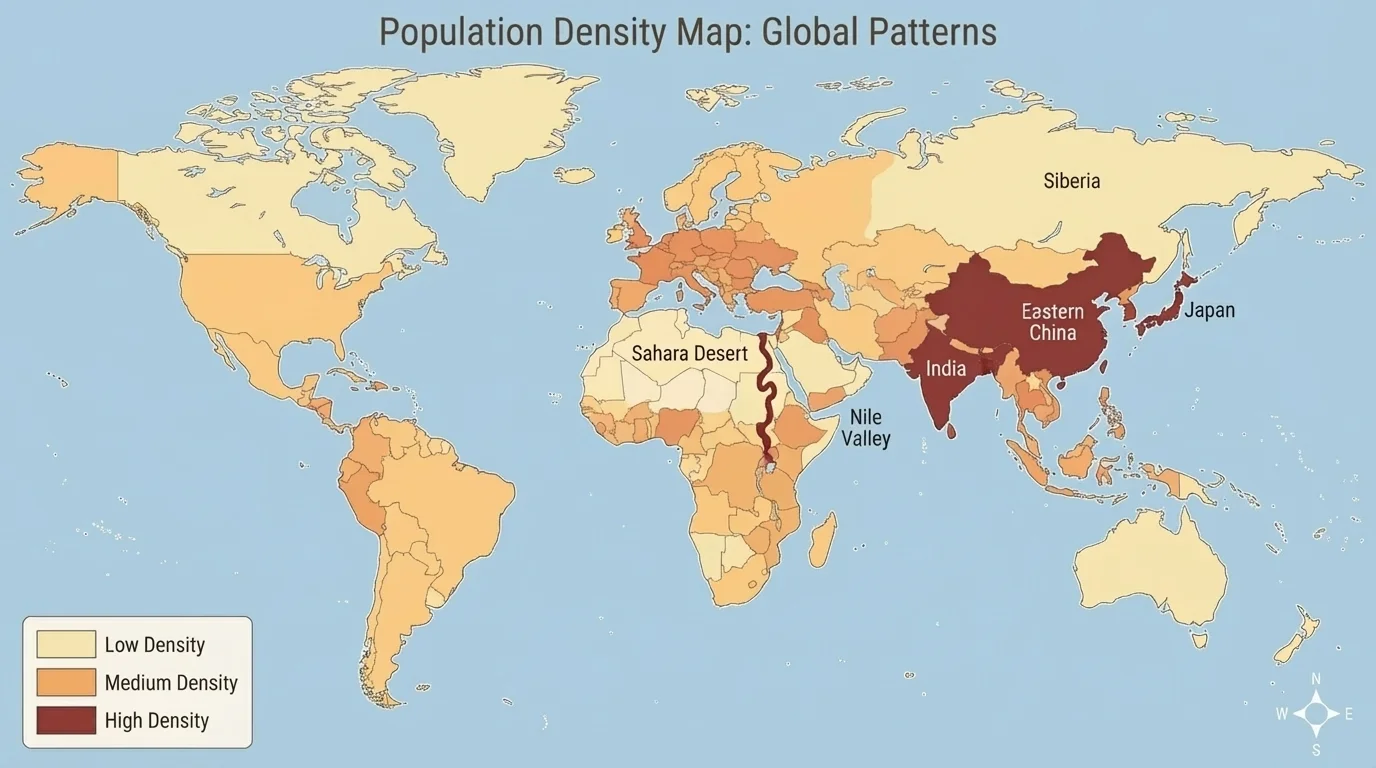
Human geography studies how people organize space. Some regions, such as eastern China, India, Japan, and parts of Europe, have very high population density. Other regions, such as the Sahara, Siberia, and central Australia, have far fewer people.
A population density map shows that population is not spread evenly across the Eastern Hemisphere. Dense populations often appear in areas with fertile soil, dependable water, moderate climate, and access to trade routes. Sparse populations often occur in places with extreme cold, dryness, steep mountains, or thick forests that are hard to cross.
Trade also creates patterns. Port cities grow where sea routes connect regions. The Mediterranean Sea, the Indian Ocean, and the South China Sea have supported trade for centuries. Human systems such as language, religion, migration, and urban growth also follow pathways created by geography. Mountain barriers may slow cultural exchange, while rivers and coasts often speed it up.
Agriculture shows another human pattern. Rice farming is common in wet parts of East, South, and Southeast Asia, where warm temperatures and seasonal rains support it. Herding is more common in dry grasslands and semi-arid areas where crop farming is less reliable. By comparing climate maps with agricultural maps, geographers can infer why different farming systems develop.
Urbanization is also important. Large cities often appear where transportation is easy, resources are available, and trade networks meet. Clusters of people often line coasts, river valleys, and plains rather than deserts or high mountains.
To make a geographic inference, start by asking what pattern stands out. Then compare at least two kinds of evidence. For example, if a map shows low population in central Asia, a geographer may compare elevation, temperature, and transportation routes. The inference might be that harsh climate and difficult terrain reduce settlement.
Predictions use similar thinking, but they look forward. If a fast-growing city is located in a dry region, geographers may predict future water stress. If a coastal area has rapid urban growth and frequent storms, they may predict greater flood risk. Predictions are not guesses. They are based on visible patterns and relationships.
How a geographer builds an inference
Step 1: Notice a pattern.
A population map shows dense settlement along a river but sparse settlement in nearby desert areas.
Step 2: Compare other maps.
A physical map shows the river valley, and a climate map shows the surrounding region is arid.
Step 3: Explain the relationship.
The river provides freshwater, transportation, and fertile land, so people cluster there while the dry desert supports fewer settlements.
Step 4: Predict.
If population continues to grow, water demand may increase and create shortages unless the region manages water carefully.
Good inferences use evidence from several sources. A single map may suggest an answer, but stronger conclusions come from overlapping clues. That is one reason geographers value GIS so much: it helps them compare layers quickly and carefully.
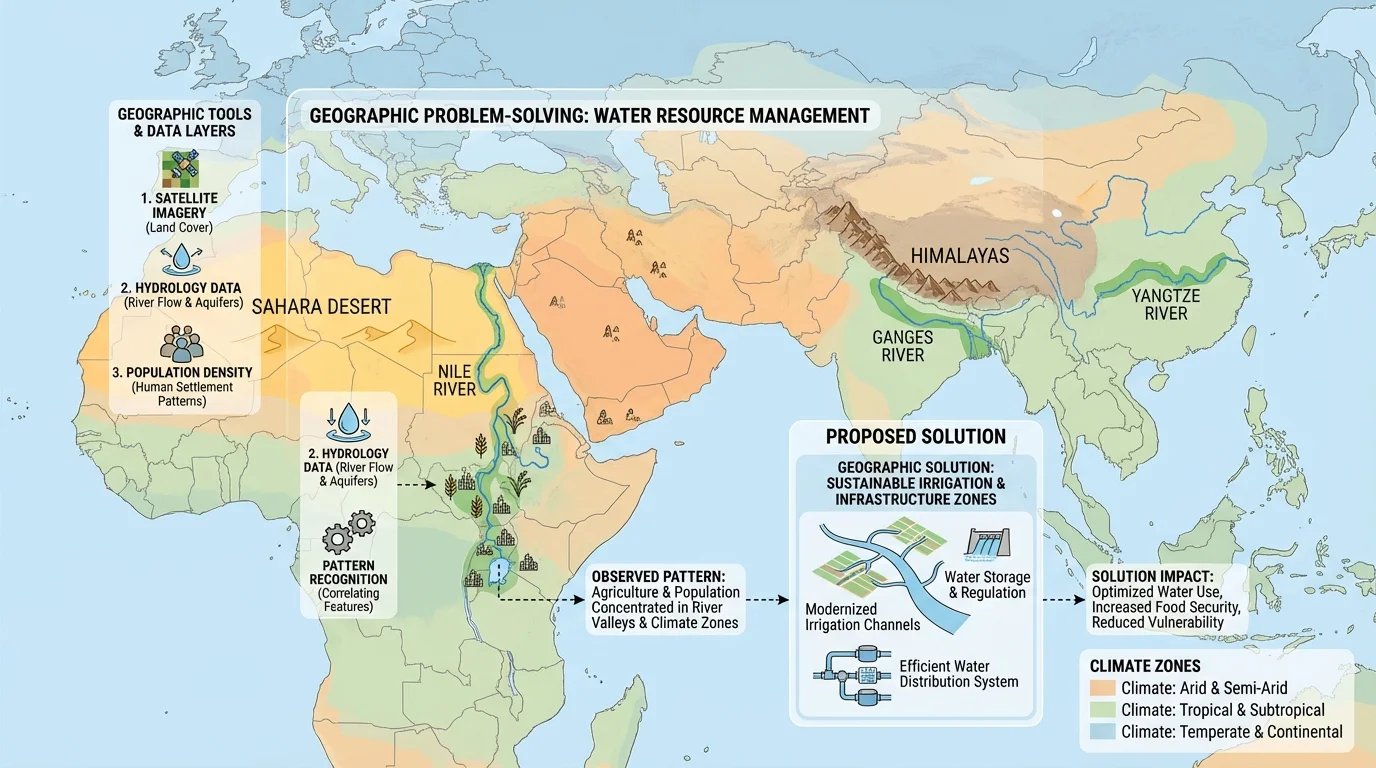
Few geographic problems are more serious than water scarcity. Much of this region has an arid climate, which means low rainfall and high evaporation. At the same time, many countries here have growing populations, expanding cities, and heavy demand for farming and industry.
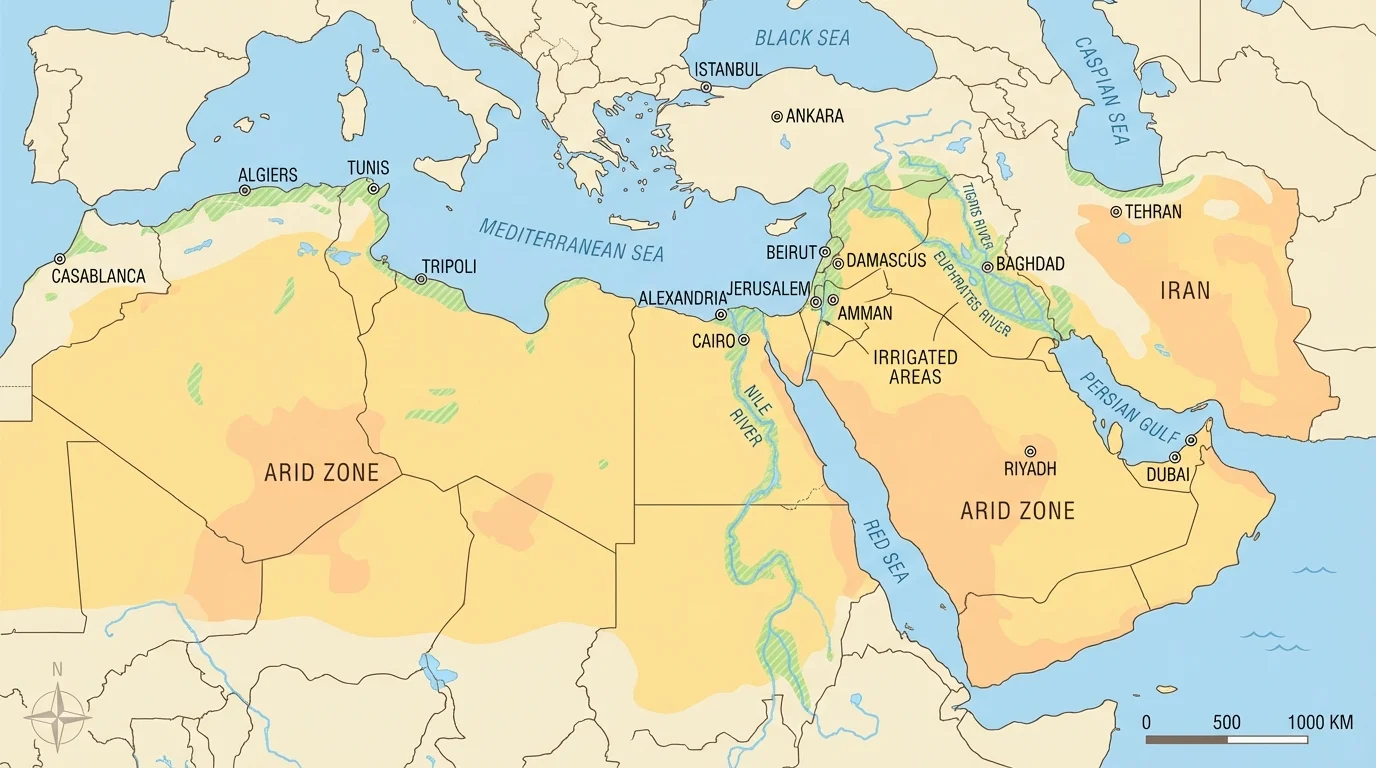
[Figure 4] When geographers compare climate maps, river maps, and population maps, they notice a strong mismatch. Freshwater is limited, but many people depend on a few major rivers and underground water sources. The Nile, the Tigris-Euphrates system, and a small number of aquifers become lifelines for millions of people.
This pattern creates several problems: overuse of rivers, conflict over shared water, pollution, and pressure on farms. Irrigation helps crops grow, but it can also waste water if systems are old or poorly designed. Cities need clean drinking water, while farmers need reliable supplies for food production. Both needs are important.
Geographers investigate this problem by asking where water is available, where people live, and how the two patterns overlap. The answer is often that the highest demand is concentrated in places where nature provides the least. That makes this a geographic problem, not just a weather problem.
Proposed solutions for water scarcity
Step 1: Use efficient irrigation.
Drip irrigation delivers water close to plant roots and reduces waste compared with flooding fields.
Step 2: Recycle and treat water.
Some urban wastewater can be cleaned and reused for agriculture or landscaping.
Step 3: Protect shared rivers.
Countries that use the same river system need agreements about conservation, pollution control, and fair distribution.
Step 4: Match crops to climate.
Growing less water-intensive crops in the driest areas can reduce pressure on limited supplies.
As the patterns make clear, the best solution is usually not one giant project. It is a combination of technology, cooperation, and smarter land use.
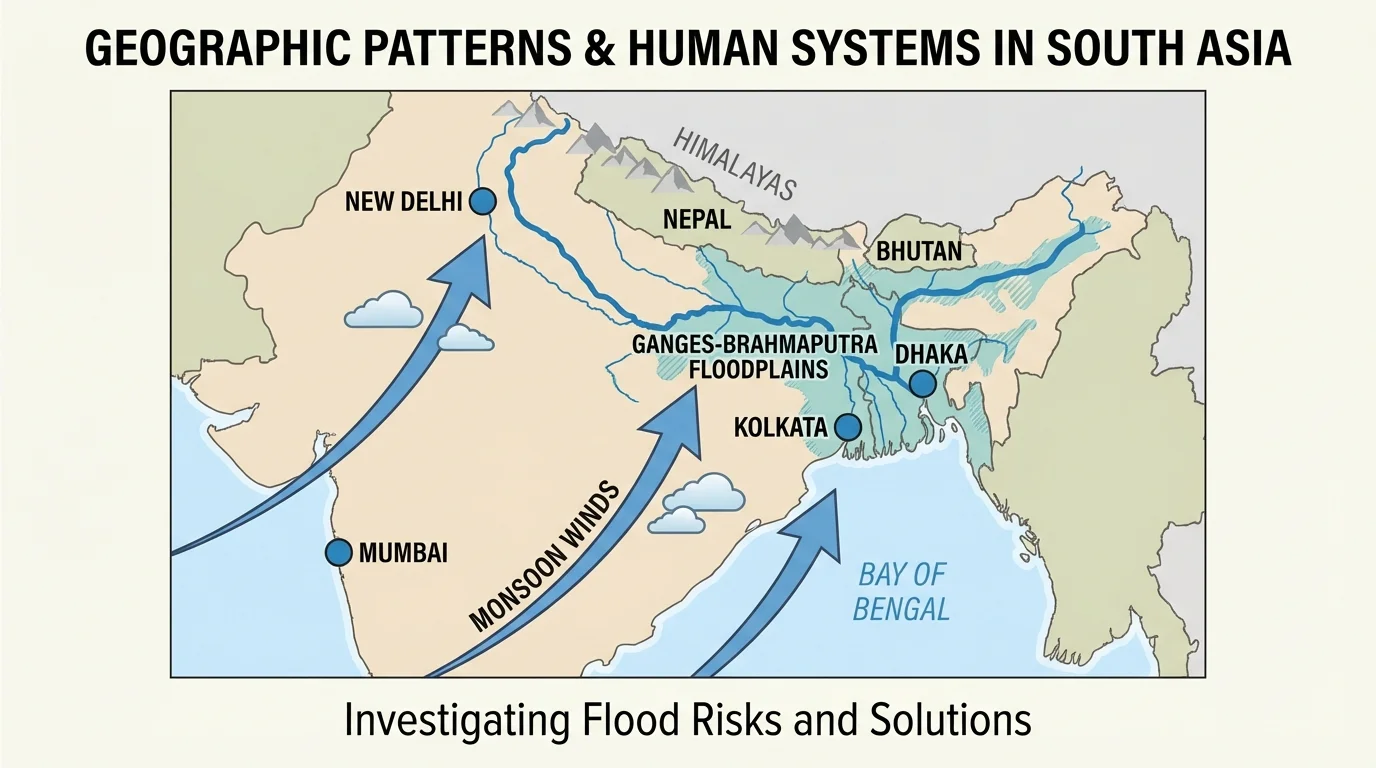
South Asia shows the opposite problem: in some places, there is not too little water but too much in a short time. Seasonal winds called the monsoon bring heavy rains to countries such as India and Bangladesh.
[Figure 5] Floodplains are attractive places for farming because rivers leave behind rich soil. That is one reason many people live in the Ganges-Brahmaputra basin. But when monsoon rains are very strong, rivers overflow and large areas flood. In Bangladesh, this risk is especially high because much of the land is low and close to the sea.
Geographers use rainfall maps, river maps, elevation maps, and settlement maps together. These layers show where flood danger is greatest and which communities are most exposed. A heavily populated floodplain is more vulnerable than an empty one, even if the physical flood is the same size.
Possible solutions must fit the geography. Levees, drainage systems, raised buildings, flood-warning systems, wetland protection, and careful city planning can all help. However, building walls everywhere is not always the smartest answer. In some places, restoring wetlands allows water to spread safely and reduces damage downstream.
Later comparisons return to the same idea: useful land can also be risky land. Geography often asks people to balance benefits and dangers rather than eliminate risk completely.
Another important pattern appears when tectonic hazard maps are compared with city maps. Parts of East Asia, especially Japan, lie near plate boundaries where earthquakes are common. At the same time, these areas include major cities, industries, and ports. This means millions of people live in places with strong economic advantages but also serious natural hazards.
Geographers examine where fault zones, steep coasts, and dense urban areas overlap. The problem is not that people made a careless choice. Coastal zones support fishing, trade, and transportation. The challenge is how to reduce danger while keeping the benefits of location.
Solutions include strict building codes, earthquake drills, early warning systems, and land-use planning that avoids the most dangerous zones when possible. This is another example of geographic problem-solving: the best answer respects both human needs and physical realities.
A good geographic solution begins with a clear question. What is the problem? Where is it happening? Who is affected? Then geographers gather several types of evidence. They compare maps of physical features, human systems, and current land use. After that, they look for patterns and causes.
Next comes evaluation. A solution should be realistic for the environment, economy, and people of the region. For example, building water-intensive farms in a desert is usually less realistic than improving irrigation and choosing crops suited to dry conditions. Moving an entire city is usually harder than improving drainage, zoning, and emergency planning.
| Problem | Useful Map Types | Likely Pattern | Possible Solution |
|---|---|---|---|
| Water scarcity | Climate, rivers, population, land use | High demand in dry regions | Efficient irrigation, water recycling, conservation |
| Flooding | Rainfall, elevation, rivers, settlement | Dense settlement on low floodplains | Warnings, drainage, wetlands, raised buildings |
| Earthquake risk | Tectonic hazards, city maps, transportation | Major cities near active plate boundaries | Building codes, planning, emergency training |
| Transportation barriers | Physical, elevation, climate, roads | Mountains or deserts limit movement | Tunnels, rail corridors, route planning |
Table 1. Examples of geographic problems, the map types used to investigate them, patterns that may appear, and possible solutions.
Strong solutions are evidence-based. They also consider trade-offs. A dam may provide irrigation and electricity, but it may also displace communities or change river habitats. Geographic thinking means asking not only, "Will this work?" but also, "Who benefits, who may be harmed, and what happens next?"
One common mistake is assuming that one map tells the whole story. Another is confusing correlation with cause. If two patterns appear together, that does not always mean one caused the other. Geographers test ideas by checking multiple sources and asking whether the explanation fits the region.
Another mistake is ignoring scale. A pattern that seems true at the continental level may not hold in one local area. For example, deserts usually have low population density, but a desert city can still become large if it has trade, energy resources, or imported water.
When studying any region, remember to ask three connected questions: Where is it? What pattern do I see? Why might that pattern exist? These questions turn a map from a picture into evidence.
The most powerful geographic thinking combines observation, comparison, inference, and practical problem-solving. Maps are not just tools for locating places. They help explain why human systems develop where they do and how people can respond wisely to challenges created by the physical world.