Deviation means how far from the normal or average.
We can use standard deviation to know if certain behavior is normal or unique/extraordinary. Standard deviation is often calculated with the mean of a data set, and it helps us to know how spread out the data is. In other words, in a set of data standard deviation tells us how tightly all the various data points are clustered around the mean. Standard deviation is denoted by the symbol \('\sigma'\).
Standard deviation can easily be calculated using a calculator, spreadsheet software or math formulas that are explained below.
Let's take an example to understand it better. Let's take account of the number of fruits that your neighbours have in their houses.
| Neighbor | No. of fruits ( X) |
| Sam | 3 |
| Daniel | 4 |
| Robin | 6 |
| Mary | 7 |
| Kim | 9 |
The number of fruits are data points which are denoted by x and Mean is represented by \(\bar{x}\). Mean for the above data is
\(\bar{x} = \frac{3+4+6+7+9}{5} = 5.8\)
Now form a table that shows data points(\(x\)) , mean (\(\bar{x}\)) and difference of the data point from the mean(\(x - \bar{x}\))
| \(x\) | \(\bar{x}\) | \((x - \bar{x})^2\) |
| 3 | 5.8 | 7.84 |
| 4 | 5.8 | 3.24 |
| 6 | 5.8 | 0.04 |
| 7 | 5.8 | 1.44 |
| 9 | 5.8 | 10.24 |
Find the mean of the differences \(= \frac{7.84+3.24+.04+1.44+10.24}{5} = 4.56\)
Standard Deviation:
\(\sigma = \sqrt{4.56} = 2.13\)
Mean = 5.8 fruits
Standard Deviation = 2.13 fruits
Now we can easily figure out who are within one standard deviation and who are beyond it. So standard deviation helps us to know what are normal cases and what are extraordinary cases.
We can expect about two-third of data to fall within +1 or -1 standard deviation from the mean. We can say \(\frac{2}{3}^{rd}\) of neighbours have between 7.93(5.8 + 2.13) and 3.67 (5.8 - 2.13) fruits in their houses.
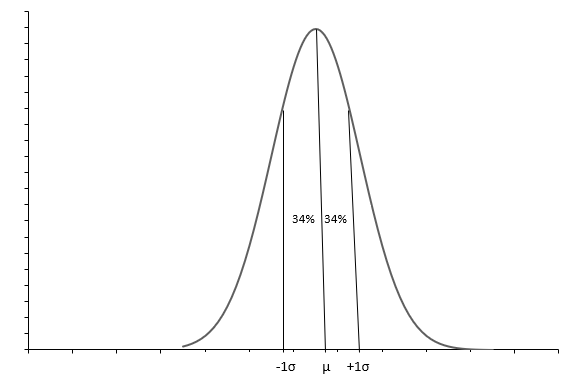
The above graph shows a normal distribution with a bell shape curve. Each Normal distribution is defined with the mean(\(\mu\)) and standard deviation(\(\sigma\)). Approx 68% of observations fall between \(+1\sigma\) and \(-1\sigma\). The mean(\(\mu\)) also the median tells us the mid-point of the distribution, around which all the data values are spread. Standard deviation(\(\sigma\)) tells us how to spread out the data is.
To calculate standard deviation follow the below steps:
1) Find mean(\(\bar{x}\)) of the data items in the given set
2) Take each difference of data item from the mean, square it, and then average the result. This result is called Variance
3) Take the square root of the Variance, this will give Standard Deviation \(\sigma\)