Why does a plant near a sunny window often grow better than one in a dark corner? Why does a toy car roll farther down a steeper ramp? Questions like these are at the heart of science and engineering. When we answer them well, we are not just guessing. We are building explanations that tell how changes in one thing are connected to changes in another thing.
Scientists look for patterns in nature. Engineers look for patterns when they design something to solve a problem. In both cases, they often study cause and effect. They ask what changes, what stays the same, and what happens as a result. Then they use those relationships to explain a phenomenon, which is something we can observe happening in the world.
Phenomenon is an event or happening that we can observe, such as ice melting, a shadow changing length, or a seed sprouting.
Variable is anything that can change in an investigation, such as time, temperature, amount of water, or height of a ramp.
Explanation is a clear statement that tells what happened, why it happened, and what evidence supports it.
A good explanation does more than say, "It happened." It says, "It happened because this variable changed, and we can see the pattern in our evidence." Sometimes the relationship is described with words. Sometimes it is described with numbers. Both kinds are important.
In science, an explanation tells how or why something happens in nature. For example, if puddles disappear after a sunny day, a scientific explanation says that heat from the Sun makes liquid water change into water vapor. In engineering, an explanation can help us understand why one design works better than another. For example, a larger parachute may fall more slowly because it catches more air.
Good explanations are based on evidence. Evidence can come from observations, measurements, data tables, tests, and experiments. If students measure a plant each week and see that the plant with more light grows taller, those measurements help support the explanation.
From earlier science work, you may remember that a fair test changes only one thing at a time. That helps us tell which variable is causing the change we observe.
Explanations are useful because they help us make predictions. If we know that more sunlight helps a plant grow, we can predict that a plant moved to a brighter place may grow better.
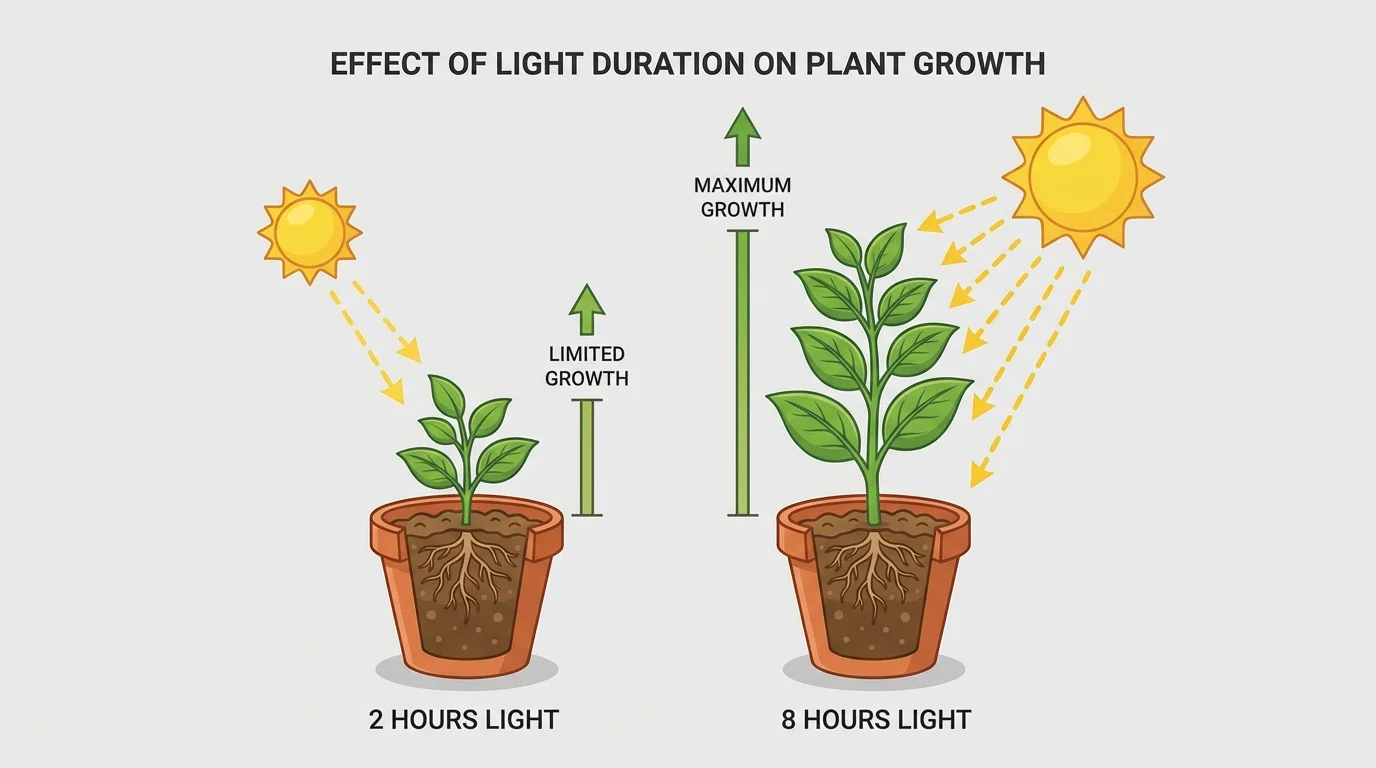
To explain something clearly, we first need to find the variables. In many situations, one variable changes and another responds, as [Figure 1] shows in a plant investigation. If students give two plants different amounts of light and then measure height, the amount of light is one variable and plant height is another.
We can ask simple questions to identify variables. What are we changing? What are we measuring? What are we keeping the same? If one plant gets light for \(8\) hours and another gets light for \(2\) hours, then the duration of light exposure changes. If both plants get the same soil, the same cup size, and the same amount of water, those things are kept the same.
Sometimes people call the variable that is changed the independent variable. The variable that responds or is measured is called the dependent variable. Students in Grade \(4\) do not always need these names, but the idea is very helpful: one thing changes, and another thing is observed.
Here are some examples of variables in common situations:
| Situation | Variable that changes | Variable that responds |
|---|---|---|
| Plant growth test | Hours of light | Plant height |
| Toy car on ramp | Ramp height | Distance traveled |
| Ice in warm room | Temperature | Time to melt |
| Sugar in water | Water temperature | Speed of dissolving |
Table 1. Examples of changing variables and responding variables in science situations.
When we choose variables carefully, we can explain results more clearly. Later, when we make predictions, we can say what will probably happen if the changing variable increases, decreases, or stays the same.
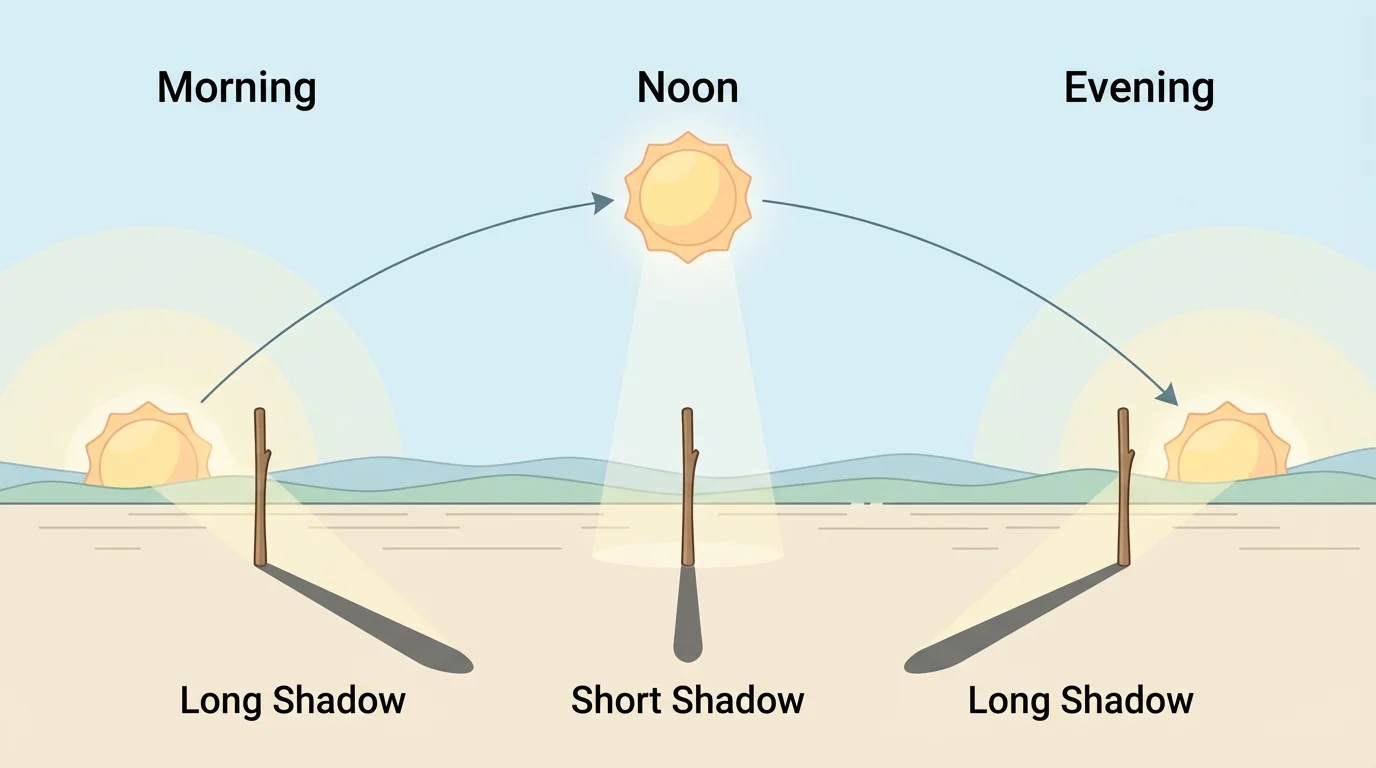
A qualitative relationship describes how variables are connected using words instead of exact numbers. These relationships often use words like more, less, faster, slower, brighter, and dimmer. The changing shadow of a stick during the day, as [Figure 2] illustrates, is a good example. When the Sun is lower in the sky, the shadow is longer. When the Sun is higher, the shadow is shorter.
Qualitative relationships are very useful when we can see a pattern clearly, even before measuring. For example, if you stir sugar into hot water and cold water, you may notice that sugar dissolves faster in the hot water. You might say, "As water temperature increases, the sugar dissolves faster." That is a strong qualitative explanation.
Another example comes from sound. When you pluck a rubber band gently, the sound is softer. When you pluck it harder, the sound is louder. The relationship can be described in words: as the force of the pluck increases, the loudness increases.
Why words matter in explanations
Scientists do not always begin with numbers. Often, they first notice a pattern in words: warmer water melts ice faster, steeper ramps make cars move faster, and more wind makes a pinwheel spin faster. These word patterns help scientists decide what to measure next.
Qualitative relationships help us explain many everyday phenomena. They are especially helpful when exact measuring tools are not available or when we are first studying a new pattern. Still, when possible, adding numbers can make the explanation even stronger.
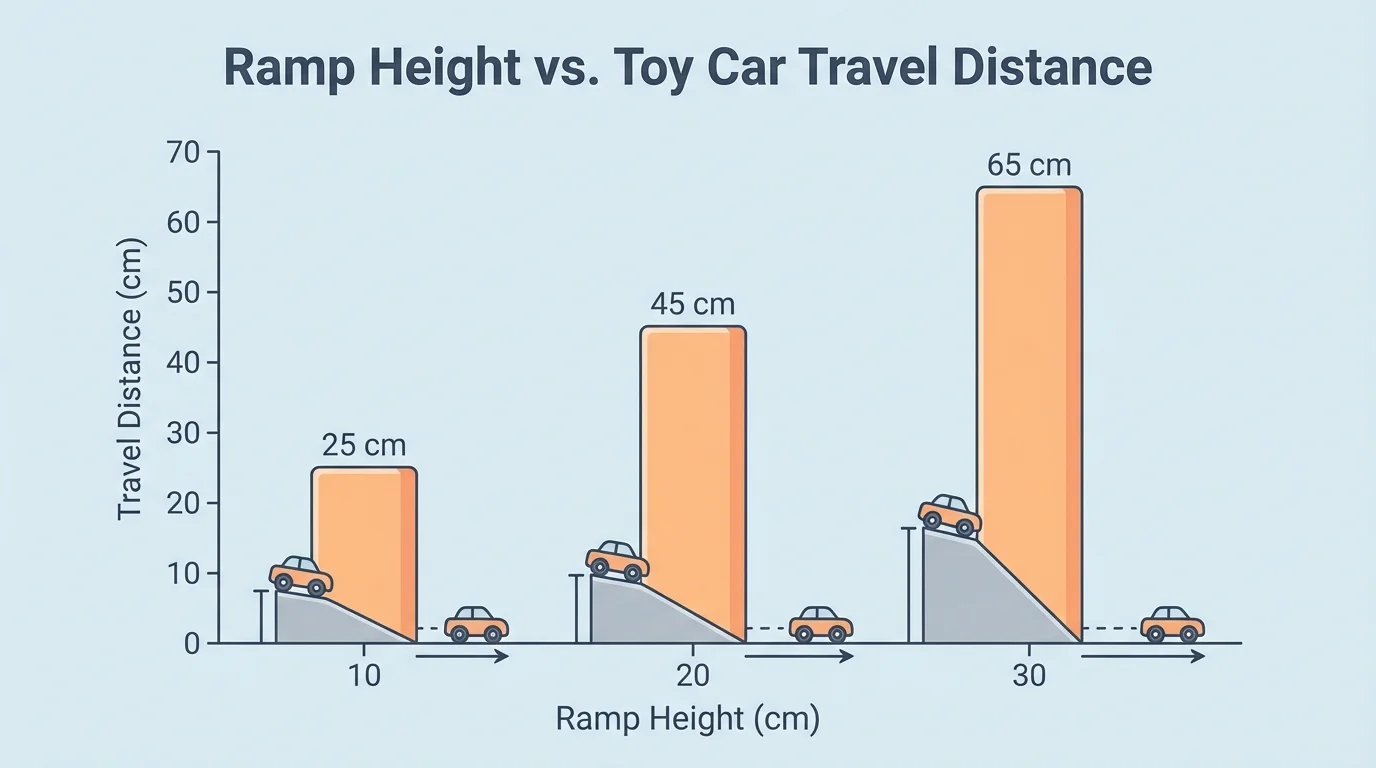
A quantitative relationship uses numbers or measurements to show how variables are connected. Numbers make patterns easier to see, as [Figure 3] shows with a ramp and toy car test. Instead of saying "the car went farther," we can say exactly how far it went.
Suppose a toy car rolls down ramps of different heights. Students measure the distance traveled on the floor. They get results like this: at \(10 \textrm{ cm}\), the car travels \(40 \textrm{ cm}\); at \(20 \textrm{ cm}\), it travels \(75 \textrm{ cm}\); at \(30 \textrm{ cm}\), it travels \(110 \textrm{ cm}\). These measurements show a pattern: when ramp height increases, distance traveled also increases.
We can also compare values using subtraction. If a plant grows \(12 \textrm{ cm}\) in bright light and another grows \(7 \textrm{ cm}\) in dim light, the difference is
\(12 - 7 = 5\)
This means the plant in brighter light grew \(5 \textrm{ cm}\) taller.
Sometimes a simple formula helps explain a relationship. One useful formula is for speed:
\[\textrm{speed} = \frac{\textrm{distance}}{\textrm{time}}\]
If a toy car travels \(60 \textrm{ cm}\) in \(3 \textrm{ s}\), then its speed is \(\dfrac{60}{3} = 20 \textrm{ cm/s}\). If another car travels the same distance in \(2 \textrm{ s}\), then its speed is \(\dfrac{60}{2} = 30 \textrm{ cm/s}\). The second car is faster.
Example: Explaining ice melting with numbers
Two cups each hold one ice cube. Cup A is in a room at \(30^\textrm{C}\). Cup B is in a room at \(20^\textrm{C}\). The ice in Cup A melts in \(8\) minutes. The ice in Cup B melts in \(14\) minutes.
Step 1: Identify the changing and responding variables.
The changing variable is temperature. The responding variable is melting time.
Step 2: Compare the numbers.
The ice in the warmer cup melts in \(8\) minutes, which is less time than \(14\) minutes.
Step 3: Write the explanation.
As temperature increases, the time needed for ice to melt decreases.
The data support a quantitative explanation because the exact temperatures and times are included.
Quantitative relationships can appear in tables, graphs, and measurements. They are powerful because they help us compare, calculate, and make more exact predictions. When we look back at the shadow example from [Figure 2], adding shadow lengths in centimeters would turn a qualitative pattern into a quantitative one.
A strong explanation often includes three parts: a statement about what happened, evidence to support it, and reasoning that connects the evidence to the idea. Some teachers call this claim, evidence, and reasoning.
Claim is the answer or main idea you are explaining.
Reasoning is the scientific thinking that shows why the evidence supports the claim.
Here is a simple pattern for building an explanation: first, state the relationship between the variables. Next, include observations or measurements. Then explain why that relationship causes the phenomenon.
For example, if bean plants with more sunlight grow taller, the explanation should not stop at "Plant A was taller." It should continue: "Plant A got more sunlight, and plants use sunlight to make food for growth. Because Plant A had more light, it could grow taller."
Example: Bean plant explanation
Step 1: Claim
The bean plant with more sunlight grew taller.
Step 2: Evidence
Plant A got \(8\) hours of light and grew to \(15 \textrm{ cm}\). Plant B got \(4\) hours of light and grew to \(9 \textrm{ cm}\).
Step 3: Reasoning
Plants need sunlight to make food. More sunlight helped the plant grow more.
This explanation is stronger than a guess because it uses both measurements and science ideas.
Clear explanations also use careful language. Words like because, therefore, so, and as a result help connect ideas. They show that the explanation is based on a relationship, not just on a list of facts.
Once we understand a relationship between variables, we can use it to predict what may happen next. A prediction is a statement about what is likely to happen based on evidence and patterns.
Suppose students notice that seeds watered every day sprout sooner than seeds watered only once a week. If a new seed is watered every day, they can predict that it will probably sprout sooner too. The prediction is not magic. It comes from the pattern they already observed.
Predictions can be qualitative or quantitative. A qualitative prediction might be, "The steeper ramp will make the car go farther." A quantitative prediction might be, "If the pattern continues, a ramp at \(40 \textrm{ cm}\) may make the car travel more than \(110 \textrm{ cm}\)."
Weather forecasts are built on predictions. Scientists measure variables such as temperature, air pressure, and wind speed, then use those relationships to predict rain, snow, or sunshine.
Predictions are stronger when they are based on many observations, careful measurements, and fair tests. If the evidence is weak or incomplete, the prediction may be less reliable.
Many natural phenomena can be explained by relationships between variables. The more examples we study, the better we become at noticing patterns.
Example 1: Shadows and sunlight. As the Sun appears higher in the sky, shadows become shorter. As the Sun appears lower, shadows become longer. This relationship helps explain why a shadow changes during the day.
Example 2: Ramps and motion. As ramp height increases, a toy car often moves faster and travels farther. The graph in [Figure 3] makes that increasing pattern easy to see. This helps explain why steeper playground slides feel faster too.
Example 3: Water temperature and dissolving. As water temperature increases, sugar dissolves faster. If one cup of water is \(15^\textrm{C}\) and another is \(35^\textrm{C}\), the warmer water often dissolves the sugar sooner.
Example 4: Plant growth and light. As light time increases, plant growth often increases, as shown earlier in [Figure 1]. This helps explain why gardeners pay attention to where they place plants.
These examples show that explanations can come from living things, physical science, and Earth science. The same thinking works in all of them: identify variables, observe patterns, describe the relationship, and use evidence to explain the phenomenon.
Engineers also study relationships between variables, but they often use them to improve a design. They ask questions like: Which bridge shape holds more weight? Which paper airplane flies farther? Which parachute falls more slowly? Changing one design feature at a time helps engineers see which variable matters most, as [Figure 4] illustrates with parachute size.
Suppose students design toy parachutes from plastic bags. One parachute has a small canopy, one has a medium canopy, and one has a large canopy. If the large canopy takes the longest time to fall, that gives evidence that larger canopy size can increase air resistance and slow the fall.
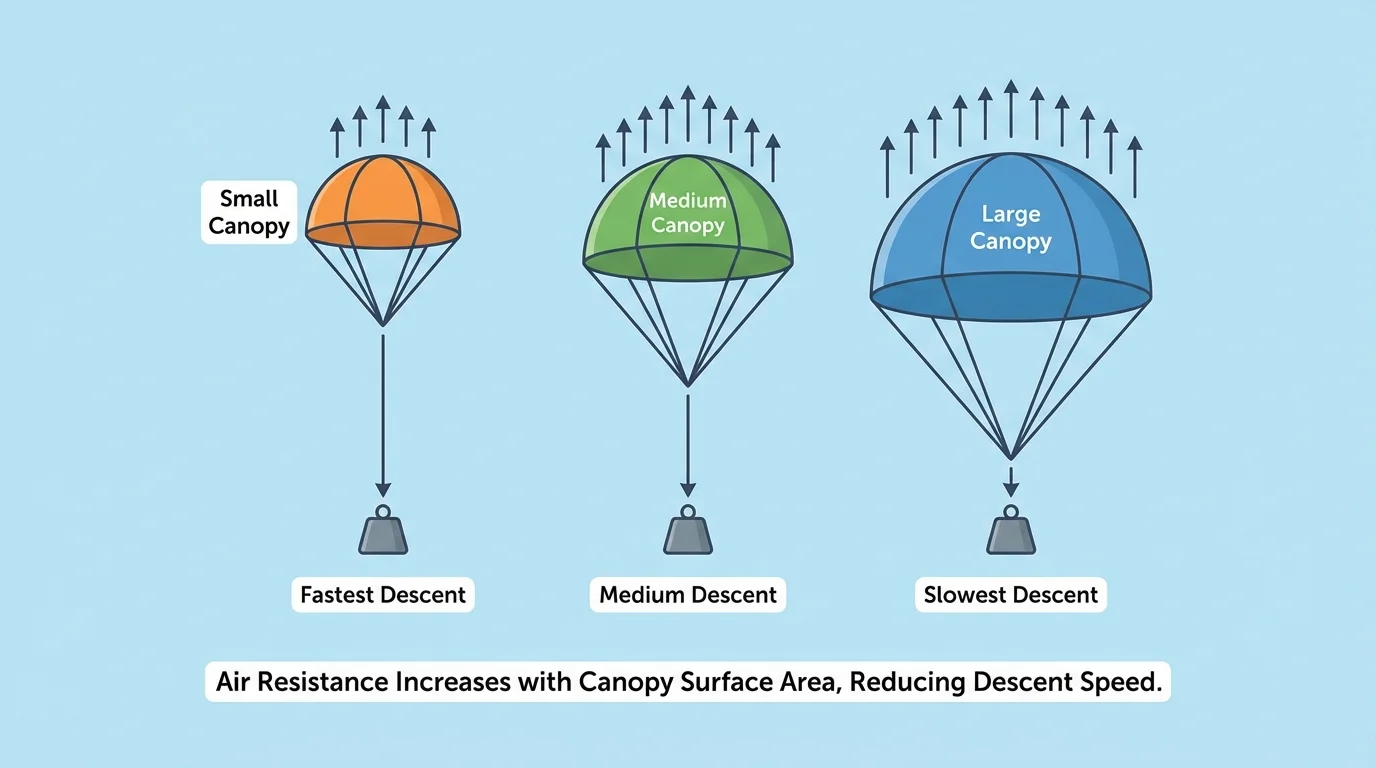
That relationship can be described in words: as canopy size increases, falling speed decreases. It can also be measured with numbers. If a small parachute falls in \(2 \textrm{ s}\), a medium parachute in \(3 \textrm{ s}\), and a large parachute in \(4 \textrm{ s}\), the pattern supports the explanation.
Example: Choosing the best parachute design
Step 1: Identify the problem.
The toy figure falls too quickly and needs a safer landing.
Step 2: Test one variable.
Change canopy size while keeping the toy figure and string length the same.
Step 3: Collect data.
Small canopy: \(2 \textrm{ s}\); medium canopy: \(3 \textrm{ s}\); large canopy: \(4 \textrm{ s}\).
Step 4: Explain the result.
The large canopy is the best design because increasing canopy size increased fall time and made the descent slower.
This is an engineering explanation because it uses evidence to decide which design works better.
Engineers often repeat tests, revise designs, and test again. If the first solution is not strong enough, they change another variable and see what happens. This is why good explanations are so useful in design work. They help people improve solutions, not just describe results.
Even a careful explanation may need to change when new evidence appears. Science is not about sticking to a first idea forever. It is about using evidence honestly.
For example, a student may think that more water always makes a plant grow better. But after testing, the student may notice that too much water can harm the plant. The explanation must be revised to match the evidence. A better explanation might be that plants need enough water, but too much water can also cause problems.
This is why fair tests matter. If many variables change at once, it becomes hard to know which one caused the result. If one plant gets more light, more water, and better soil, we cannot tell which variable caused the extra growth.
"Good explanations grow stronger when evidence grows stronger."
Predictions also have limits. A pattern that works in one situation may not work in every situation. For instance, a steeper ramp may usually make a toy car go farther, but a rough floor could slow it down. Scientists and engineers pay attention to these limits so their explanations stay accurate.
Learning to explain phenomena with variable relationships is a powerful skill. It helps us understand nature, solve problems, and make smart predictions. From growing plants to building parachutes, the same idea guides us: notice what changes, measure what happens, and explain the connection clearly.