South America and Africa fit together so well that they look like pieces of a broken puzzle. That is not just a coincidence. Scientists noticed that continental margins, fossils, rock layers, and even mountain ranges match across oceans. When patterns repeat in nature, they often reveal a hidden process. In Earth science, those patterns show that the surface of our planet has moved over millions of years.
A rate of change tells us how fast something changes over time. In Earth science, rates of change may be very slow compared with human life. A tectonic plate might move only a few centimeters each year, but over millions of years that movement can open an ocean or build a mountain range. Scientists look for numerical patterns because they help explain what cannot be watched directly.
Another useful idea is a numerical relationship. This means two measurements are connected in a meaningful way. For example, if the distance from a mid-ocean ridge increases and the age of the seafloor also increases, that relationship suggests new crust forms at the ridge and moves outward. A pattern like that is strong evidence for a process happening over time.
Pattern is something that repeats in a predictable way. A natural system is a group of parts in nature that interact, such as Earth's crust, oceans, atmosphere, and interior. Scientists study patterns in natural systems to figure out causes, not just to list observations.
Earth science depends on evidence from many places and many time periods. Since no person has watched continents drift apart over hundreds of millions of years, scientists combine maps, fossil data, rock records, and seafloor measurements. When different kinds of evidence all point to the same explanation, confidence in that explanation grows.
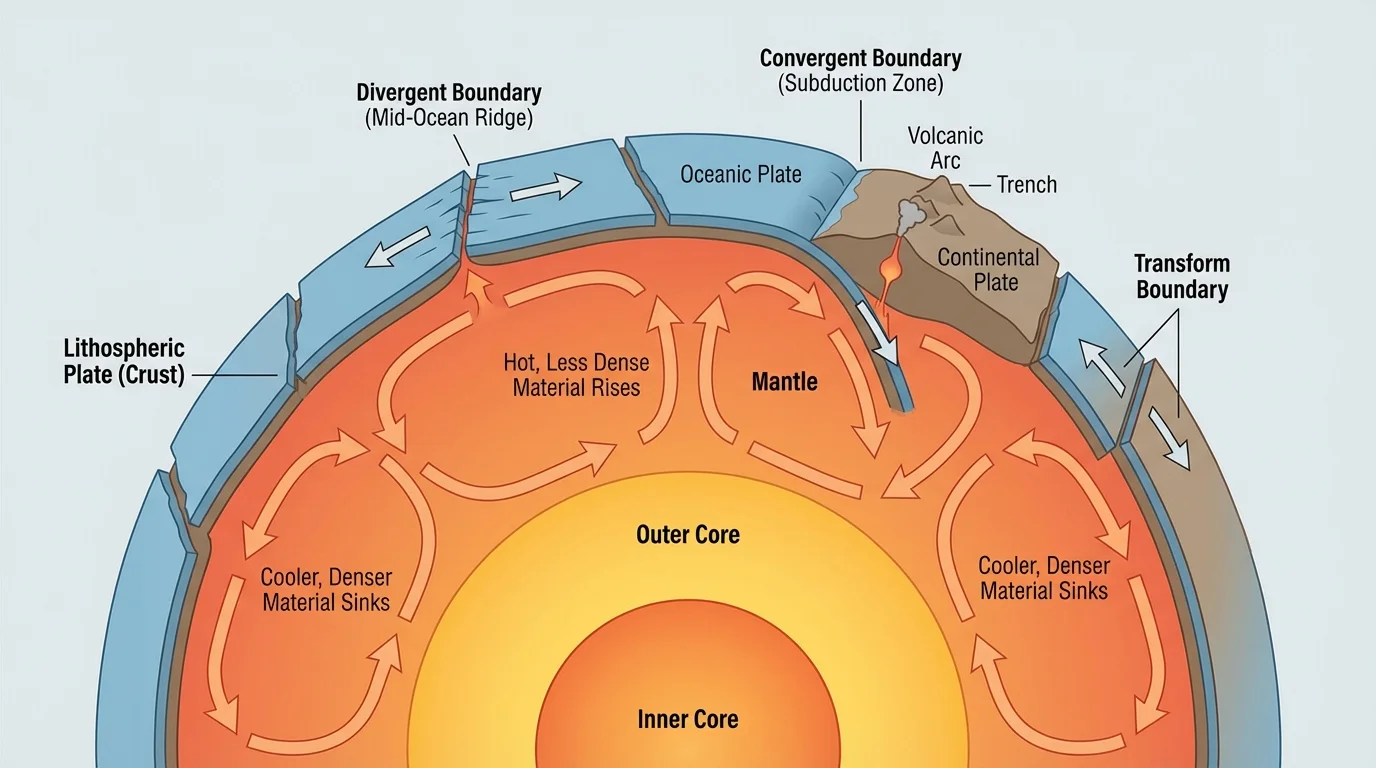
[Figure 1] The outer part of Earth is broken into large pieces called tectonic plates. These plates move slowly over the softer layer beneath them. Earth's rigid outer shell rides on deeper material that can flow very slowly, allowing plates to shift over time.
The system includes the crust, the upper mantle, heat from Earth's interior, and the motion of material below the plates. This movement is not random. Plates can move apart, crash together, or slide past each other. These interactions help explain earthquakes, volcanoes, deep ocean trenches, and mountain chains.
Even though plate motion is slow, scientists can still measure it. If a plate moves about \(3\ \textrm{cm/year}\), then in \(100\ \textrm{years}\) it moves about \(300\ \textrm{cm}\), which is \(3\ \textrm{m}\). That may not sound like much, but in \(1{,}000{,}000\ \textrm{years}\) the movement would be \(3{,}000{,}000\ \textrm{cm}\), or \(30\ \textrm{km}\). Slow change over a long time can create enormous results.
Calculating a simple plate-motion distance
A plate moves at \(5\ \textrm{cm/year}\) for \(2{,}000{,}000\ \textrm{years}\). How far does it travel?
Step 1: Use the relationship
\[distance = rate \times time\]
Step 2: Substitute the values
\(distance = 5\ \textrm{cm/year} \times 2{,}000{,}000\ \textrm{years} = 10{,}000{,}000\ \textrm{cm}\)
Step 3: Convert to kilometers
\(10{,}000{,}000\ \textrm{cm} = 100{,}000\ \textrm{m} = 100\ \textrm{km}\)
The plate travels \(100\ \textrm{km}\).
This is why Earth scientists pay attention to rates. Tiny yearly changes can create continents, oceans, and mountain belts when enough time passes.
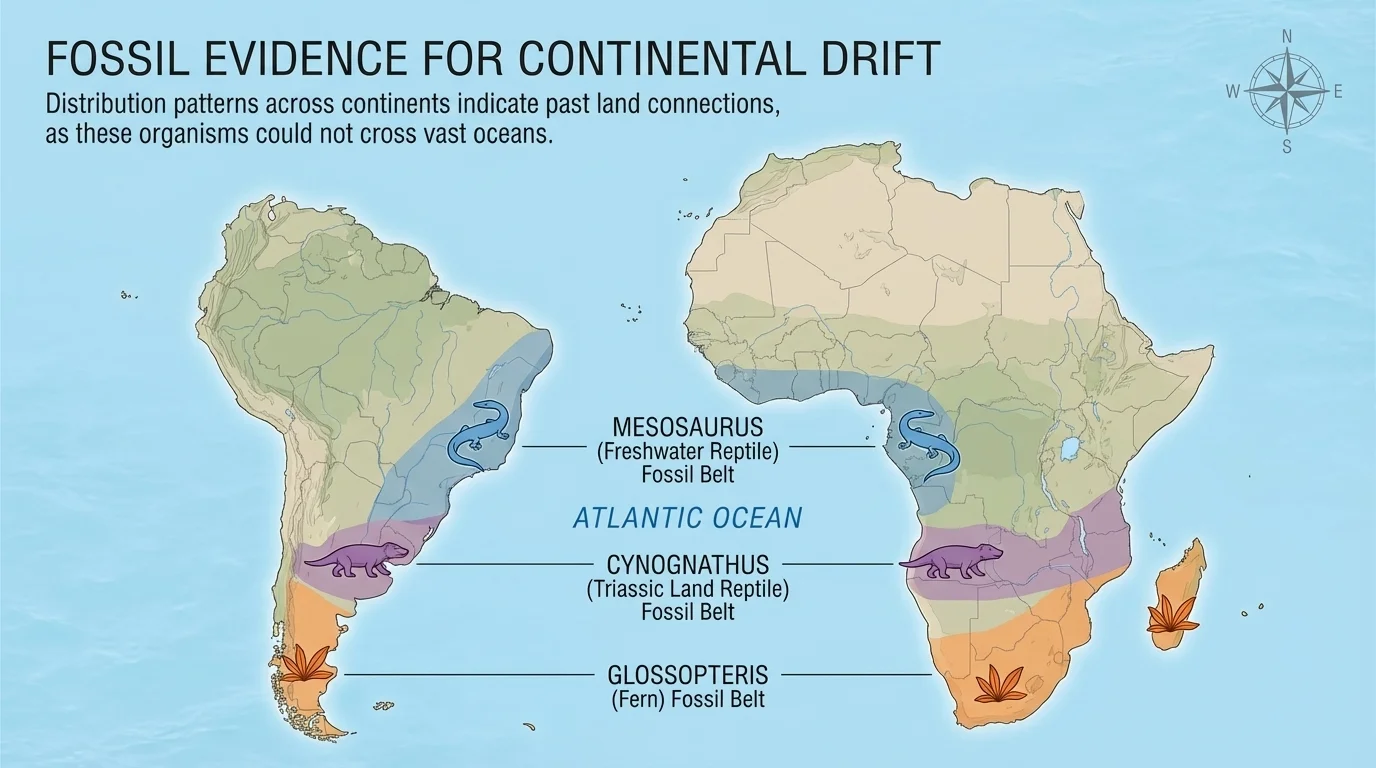
[Figure 2] The distribution of fossils gives some of the clearest evidence for past plate motion. Fossil patterns on continents now separated by wide oceans can line up in remarkable ways. If the same land animal fossil is found on two continents, scientists ask whether those continents were once connected.
One famous example is Mesosaurus, a small reptile that lived in freshwater. Its fossils have been found in South America and Africa. It is unlikely that this animal swam across a huge saltwater ocean. A more reasonable explanation is that the continents were once joined. Another example is Glossopteris, a seed fern whose fossils appear across South America, Africa, India, Antarctica, and Australia.
These fossil matches are not just about one species. Scientists compare many fossil types and their ages. When multiple fossil distributions fit together, they form a stronger pattern. Fossils also tell scientists about past climates. For example, plant fossils found in Antarctica suggest that it was once located in a warmer region or had a very different climate when those plants lived.
Antarctica is now covered in ice, but it contains fossils of forests and other organisms that lived in much milder conditions. That surprising pattern helps scientists reconstruct both continental movement and ancient climate.
Fossils work best when used with other evidence. A matching fossil on two continents is important, but when that fossil evidence also agrees with rock layers and continental shape, the explanation becomes much stronger.
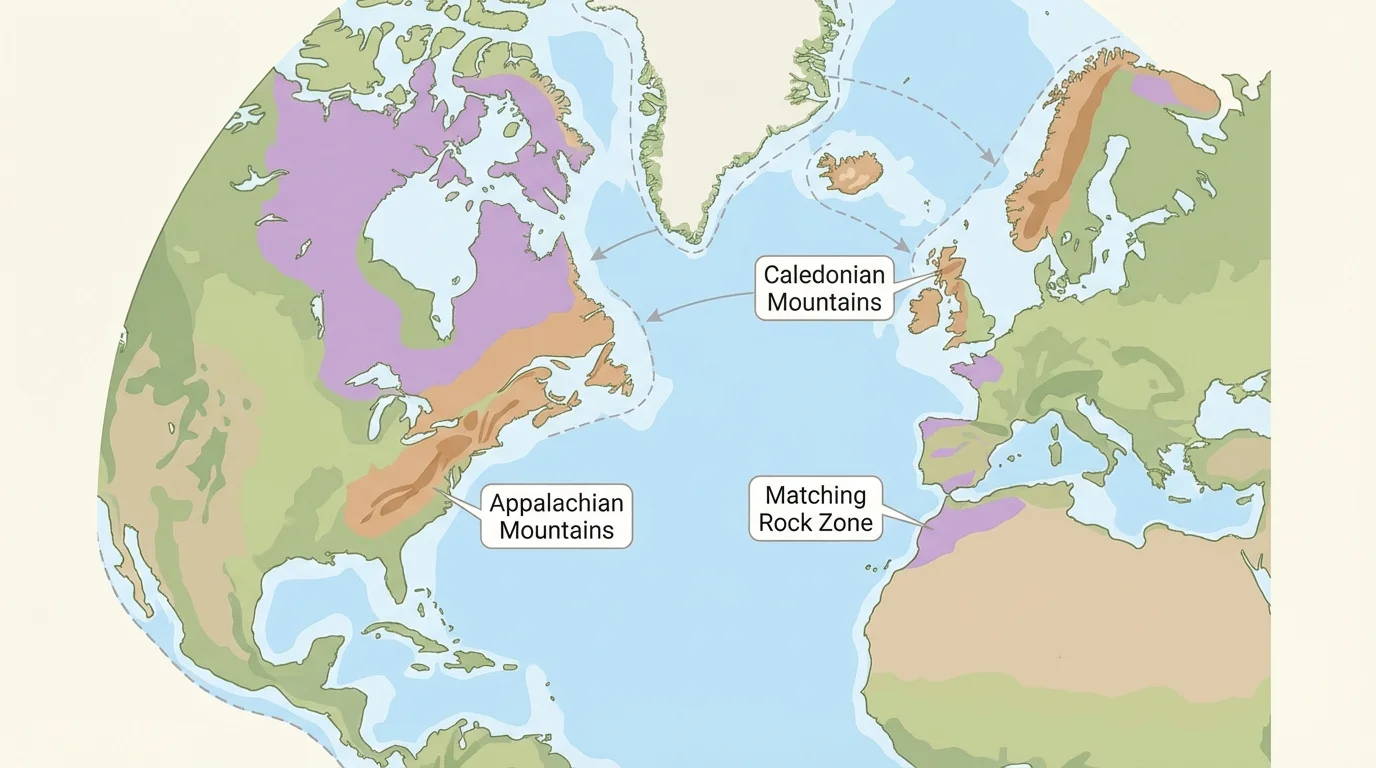
[Figure 3] The pattern of mountain belts and rock layers also reveals Earth's history. When scientists compare continents, they sometimes find rock types, ages, and structures that match across an ocean. These matching zones can line up as if they were once part of the same larger region.
For example, the Appalachian Mountains in eastern North America match in age and structure with mountain belts in Greenland and northern Europe, such as the Caledonian Mountains. This suggests that these land areas were once connected before the Atlantic Ocean opened.
Rock evidence also includes the ages of rocks. If very old rocks on one coastline match the age and type of rocks on the opposite coastline, that pattern suggests they formed in the same setting long ago. Scientists may compare layers of sandstone, shale, and volcanic rock to look for these connections.
Glacial scratches and deposits also provide clues. In several southern continents, rocks show marks left by ancient glaciers. Today those continents are far apart and some have warm climates, but the scratch directions and sediment patterns make more sense if the continents were once joined near the South Pole.
Why matching rocks matter
Rocks are like pages in Earth's history book. Their mineral makeup, age, and arrangement record where and how they formed. If two distant places have the same sequence of rock layers and the same ages, that is unlikely to be accidental. It suggests those places were once connected or formed under the same geologic conditions.
The evidence from rock patterns supports the same big idea as fossil patterns: Earth's surface has changed position over time.
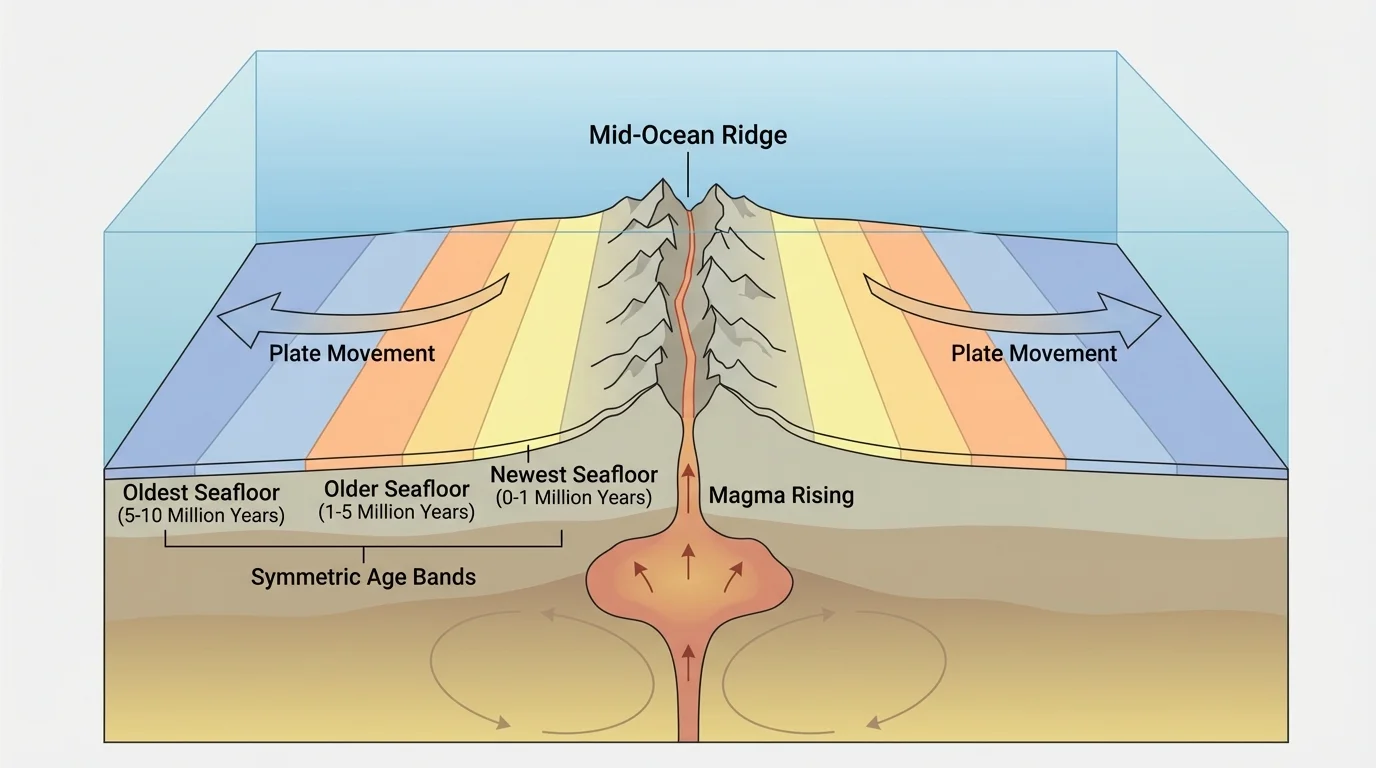
[Figure 4] One of the strongest patterns in Earth science comes from the ocean floor. Scientists discovered huge underwater mountain chains called mid-ocean ridges. Near these ridges, molten rock rises, cools, and forms new seafloor. The age pattern of the rocks is symmetrical on both sides of the ridge.
The youngest seafloor rocks are found closest to the ridge. Farther away, the rocks get older on both sides. This pattern is exactly what scientists would expect if the seafloor spreads outward from the ridge over time. Deep ocean trenches, where old crust sinks back into Earth, are often found far from ridges.
Scientists also found magnetic patterns in seafloor rocks. When lava cools, tiny iron-bearing minerals line up with Earth's magnetic field. Because Earth's magnetic field has reversed many times in the past, the seafloor contains matching magnetic stripes on either side of a ridge. These stripes act like a barcode of past spreading.
Rates of spreading can be estimated from distance and age. Suppose a rock sample is found \(40\ \textrm{km}\) from a ridge and is \(2\) million years old. The average spreading rate on that side is
\[rate = \frac{distance}{time} = \frac{40\ \textrm{km}}{2\ \textrm{million\ years}} = 20\ \textrm{km\ per\ million\ years}\]
That can be converted into centimeters per year. Since \(20\ \textrm{km} = 2{,}000{,}000\ \textrm{cm}\) and \(1\) million years \(= 1{,}000{,}000\) years, the rate is \(2\ \textrm{cm/year}\).
Finding a spreading rate
A seafloor rock is \(60\ \textrm{km}\) from a ridge and is \(3\) million years old.
Step 1: Write the formula
\[\textrm{rate} = \dfrac{\textrm{distance}}{\textrm{time}}\]
Step 2: Substitute
\[\textrm{rate} = \dfrac{60\ \textrm{km}}{3\ \textrm{million\ years}} = 20\ \textrm{km\ per\ million\ years}\]
Step 3: Convert units
\[20\ \textrm{km\ per\ million\ years} = 2\ \textrm{cm/year}\]
The spreading rate is \(2\ \textrm{cm/year}\).
This ocean-floor evidence helped transform the idea of moving continents into the modern theory of plate tectonics. Earlier evidence from fossils and rocks suggested motion, but seafloor data showed a process that is still happening today.
Scientists often organize observations in tables and graphs because patterns become easier to see. [Figure 5] A graph of rock age versus distance from a ridge can reveal whether spreading is steady, fast, slow, or changing over time.
Here is a simple set of data from one side of a ridge:
| Distance from ridge | Age of rock |
|---|---|
| \(10\ \textrm{km}\) | \(0.5\) million years |
| \(20\ \textrm{km}\) | \(1.0\) million years |
| \(30\ \textrm{km}\) | \(1.5\) million years |
| \(40\ \textrm{km}\) | \(2.0\) million years |
This table shows a regular pattern. Every increase of \(10\ \textrm{km}\) matches an increase of \(0.5\) million years. That means the rate is constant in this data set. Scientists would say the relationship is linear because equal changes in one quantity match equal changes in the other.
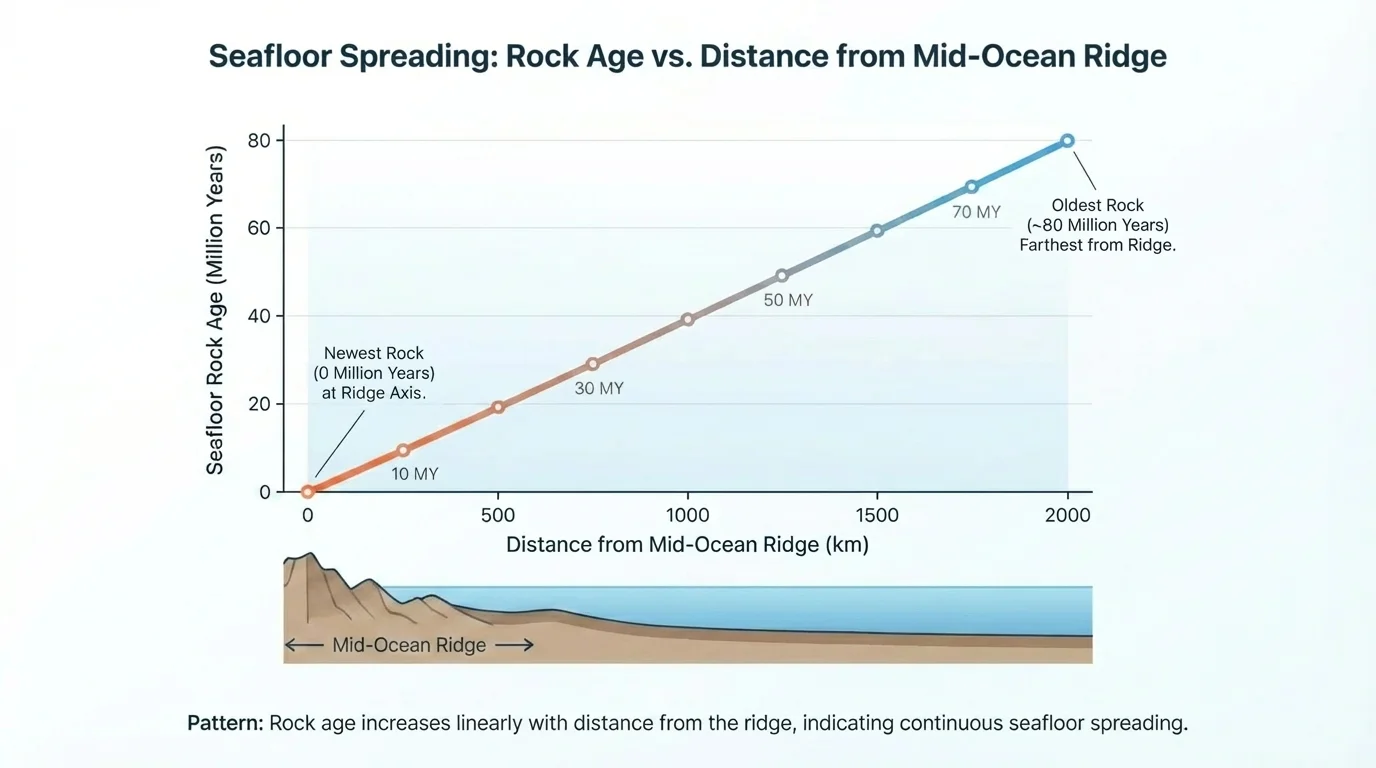
If the points on a graph form a straight trend, the spreading rate is fairly steady. If the graph curves or has breaks, the rate may have changed. This is one reason graphs are useful: they help scientists notice changes that are hard to see in words alone.
To find a rate, divide how much something changes by how much time passes. This same math is used in speed, population growth, and many kinds of Earth science data.
Scientists rarely trust one clue by itself. They compare fossil maps, rock matches, seafloor ages, and modern GPS measurements. When all the patterns agree, the explanation is much stronger. The matching fossil distribution in [Figure 2] and the symmetrical seafloor pattern in [Figure 4] support the same overall story of plate motion.
The idea of using patterns and rates is not limited to plate tectonics. Many natural systems can be understood by measuring how fast change happens. River erosion, beach changes, glacier melting, earthquake frequency, and volcanic activity all involve rates.
For example, if a cliff edge wears back \(2\ \textrm{cm/year}\), then in \(50\) years it retreats \(100\ \textrm{cm}\), which is \(1\ \textrm{m}\). If rainfall in a region rises steadily over several decades, that pattern may point to climate shifts. If small earthquakes increase near a plate boundary, scientists may study whether stress is building in the crust.
Using a numerical relationship in erosion
A riverbank erodes \(15\ \textrm{cm}\) in \(3\) years.
Step 1: Find the yearly rate
\[\textrm{rate} = \dfrac{15\ \textrm{cm}}{3\ \textrm{years}} = 5\ \textrm{cm/year}\]
Step 2: Predict future change
In \(10\) years, the erosion would be \(5\ \textrm{cm/year} \times 10\ \textrm{years} = 50\ \textrm{cm}\).
Patterns in rates help scientists estimate what may happen next.
Of course, natural systems are not always perfectly regular. A volcano may stay quiet for a long time and then erupt suddenly. A river may erode faster during storms. This is why scientists collect lots of data over time. Even when short-term changes are uneven, long-term patterns can still reveal important relationships.
Understanding plate motion is not just about the past. It helps people in the present. Earthquake zones often occur near plate boundaries. Many volcanoes form where plates meet. Mountain building can affect climate, rainfall, and where people live. By studying rates and patterns, scientists can identify hazard zones and make better maps.
Modern tools such as GPS can measure plate motion directly. Some plates move about as fast as fingernails grow. This modern evidence matches the older fossil, rock, and seafloor evidence. What scientists infer from ancient records is confirmed by measurements made today, just as age patterns from mid-ocean ridges connect with direct observations of spreading today.
"The Earth has a history written in its rocks, fossils, and landscapes."
— A guiding idea of geology
Patterns also help scientists locate resources. Certain rocks form in certain tectonic settings. Oil, gas, metal ores, and geothermal energy are often connected to plate processes. Knowing how plates moved in the past can help scientists understand where useful materials may be found today.
Most importantly, this topic shows how science works. Scientists do not guess based on one observation. They look for repeated patterns, measure rates, compare data sets, and build explanations that fit all the evidence. Continental shapes, fossil distributions, mountain belts, and seafloor structures all tell the same story: Earth's surface changes over time in ways that can be measured and understood.