A country can have rising production, falling unemployment, and a stock market hitting record highs, yet many families may still feel financially stressed when rent, groceries, and transportation become more expensive. That is one reason economists do not judge the economy by a single number. The economy is more like a dashboard than a speedometer: one gauge tracks output, another tracks prices, another tracks jobs, and still others track confidence, inequality, and long-term well-being.
An economy includes millions of workers, consumers, businesses, banks, and governments making decisions at the same time. Because of that complexity, different indicators tell different stories. One measure may suggest strength while another points to weakness. A strong labor market may exist alongside slow economic growth. Inflation may fall even when families still feel pressure because prices remain high compared with earlier years.
Economists use economic indicators to study these different parts of the economy. An economic indicator is a piece of data that helps describe current conditions or predict future changes. Some indicators focus on how much a country produces. Others focus on how quickly prices rise, how many people are working, or how confident consumers and businesses feel.
Gross Domestic Product is the total market value of final goods and services produced within a country in a given period.
Inflation is a general rise in prices over time, which reduces purchasing power.
Unemployment refers to people in the labor force who want work, are available for work, and are actively seeking a job but do not have one.
Looking at many indicators together matters because each one has strengths and weaknesses. GDP can rise while income inequality worsens. Inflation data can show average price changes, but different households buy different things, so their experiences are not identical. Unemployment can fall even if some workers stop looking for jobs and leave the labor force entirely. For that reason, economists compare several indicators before drawing conclusions.
[Figure 1] The business cycle is the pattern of expansion and contraction in economic activity over time. It connects changes in output, employment, and prices, helping explain why indicators rise and fall together in some periods and move in opposite directions in others. The main phases are expansion, peak, contraction, and trough.
During an expansion, businesses produce more, consumers spend more, and unemployment usually falls. At a peak, the economy is near its highest level before slowing down. During a contraction, output weakens, hiring slows, and unemployment often rises. At a trough, economic activity reaches a low point before recovery begins. Not every cycle has the same length or intensity. Some contractions are mild; others become deep recessions.
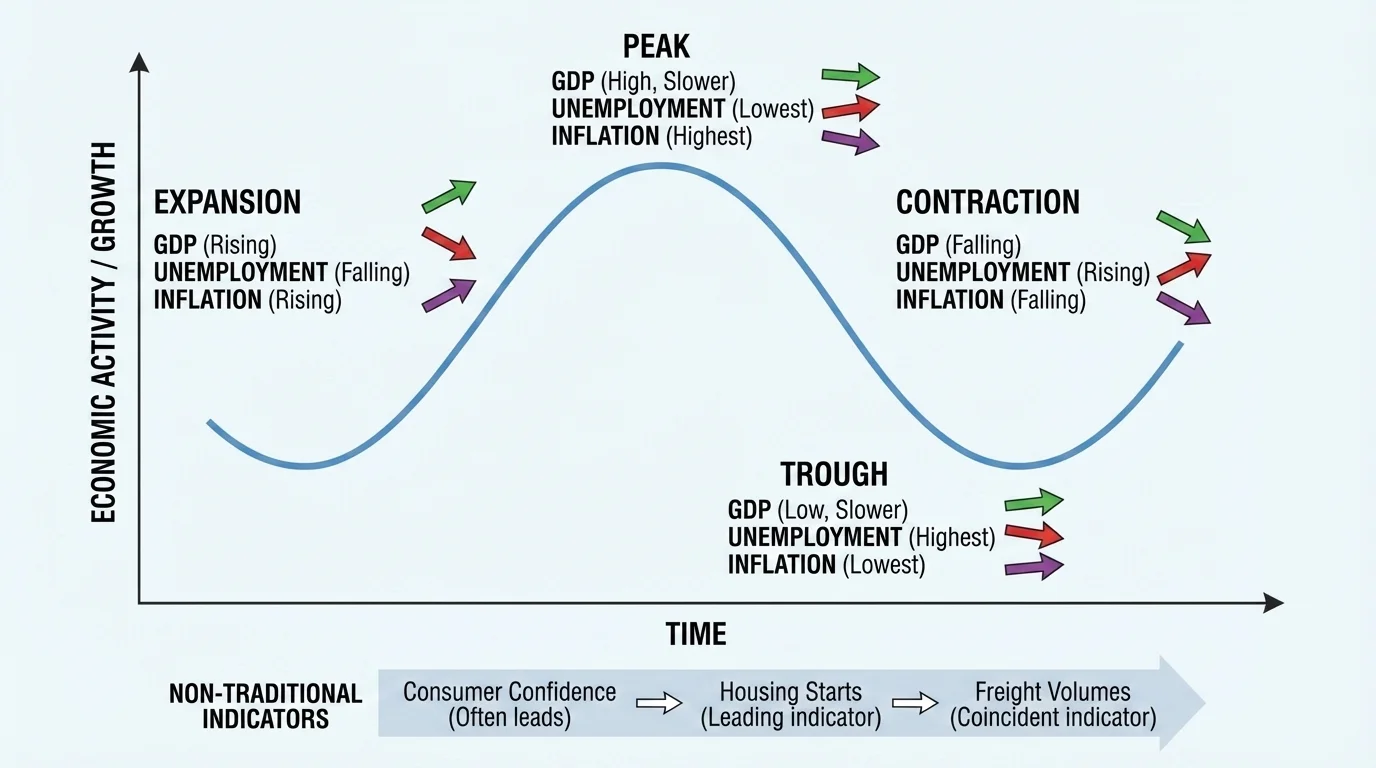
These phases affect indicators in different ways. In an expansion, GDP typically grows, unemployment tends to decrease, and inflation may begin to rise if demand becomes strong. In a contraction, GDP may shrink or grow very slowly, unemployment usually rises, and inflation often slows. However, reality is not always neat. Supply shocks, such as a sudden jump in energy prices, can cause inflation to rise even while growth slows.
That is why economists do not simply ask, "Is the economy good or bad?" Instead, they ask, "Which part of the economy is changing, and where are we in the cycle?" As we saw in [Figure 1], the same economy can look healthy from one angle and troubled from another depending on where output, prices, and employment are moving.
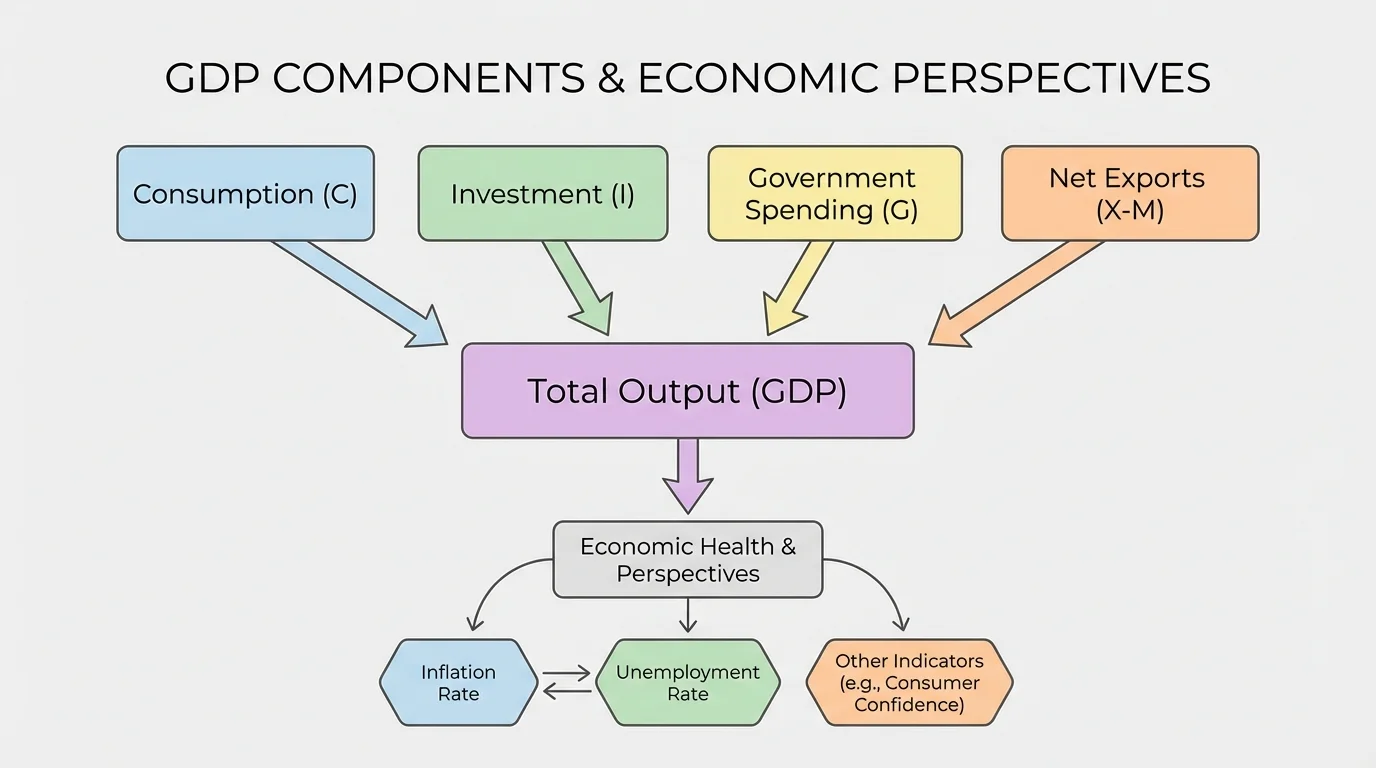
[Figure 2] Gross Domestic Product, or GDP, is one of the broadest measures of economic activity. Economists often organize GDP into major spending categories because total output can also be measured by total spending on final goods and services. When GDP rises, it usually means businesses and households are producing and buying more.
A common way to write GDP using the expenditure approach is:
\[GDP = C + I + G + (X - M)\]
Here, consumption is represented by \(C\), investment by \(I\), government spending by \(G\), exports by \(X\), and imports by \(M\). If a country has consumption of $800 billion, investment of $200 billion, government spending of $250 billion, exports of $150 billion, and imports of $100 billion, then GDP is \(800 + 200 + 250 + (150 - 100) = 1,300\) billion dollars.
Economists also distinguish between nominal GDP and real GDP. Nominal GDP measures output using current prices. Real GDP adjusts for changes in prices so that it reflects changes in actual production. This distinction matters because if prices rise sharply, nominal GDP can increase even when the quantity of goods and services changes very little.
Real vs. nominal GDP example
Suppose a country produces the same number of goods in two years, but prices rise.
Step 1: Identify the change in production.
The quantity of goods stays the same, so actual output does not increase.
Step 2: Compare the measures.
If prices rise by \(5\%\), nominal GDP may rise by about \(5\%\) even though real GDP stays nearly unchanged.
Step 3: Interpret the result.
This means nominal GDP suggests growth in dollar value, but real GDP shows little or no growth in physical output.
For judging whether the economy is actually producing more, real GDP is usually more useful.
GDP often rises during expansions and slows or falls during contractions. But GDP has limits. It does not show how income is distributed. It does not directly measure unpaid work, such as caregiving at home. It can also miss parts of the informal economy. A country may have high GDP while many people still struggle with housing, healthcare, or stagnant wages.
GDP also does not directly measure quality. If pollution cleanup spending rises after an environmental disaster, GDP may increase because more money is being spent, but that does not mean people are necessarily better off. So GDP is essential, but incomplete. The spending structure in [Figure 2] helps measure output, yet it does not capture every part of human well-being.
Inflation is the general increase in prices over time. When inflation rises, the same amount of money buys fewer goods and services. This reduction in what money can buy is called purchasing power. If a student could buy two meals for $20 one year but only one and a half similar meals the next year, inflation has reduced what that $20 can buy.
Inflation is often measured as a percentage change in a price index over time. A simplified inflation rate can be written as:
\[\textrm{Inflation Rate} = \frac{\textrm{New Price Level} - \textrm{Old Price Level}}{\textrm{Old Price Level}} \times 100\%\]
If an index rises from \(200\) to \(210\), the inflation rate is \(\dfrac{210 - 200}{200} \times 100\% = 5\%\).
Moderate inflation is common in a growing economy, but high inflation creates problems. It makes planning harder for households and businesses. Savers may lose value if their money does not earn enough interest to keep up with rising prices. People on fixed incomes may find it especially difficult to keep up. On the other hand, very low inflation or deflation, which is a general fall in prices, can also be harmful if consumers delay spending and businesses cut production.
Why inflation often changes with the business cycle
During strong expansions, consumer and business demand can grow faster than the economy's ability to produce, pushing prices upward. During contractions, weaker demand often reduces pressure on prices. However, inflation does not always follow demand alone. Supply disruptions, such as shortages of computer chips, shipping problems, or sudden increases in oil prices, can raise inflation even when growth slows.
Inflation usually rises or becomes more noticeable late in an expansion, especially if wages and spending accelerate. But the relationship is not automatic. A country can face slow growth and high inflation at the same time, a difficult combination sometimes called stagflation. That makes inflation especially important because it shows whether growth is stable or overheated.
Students often notice inflation first in everyday life: higher prices for food, concert tickets, gas, or streaming subscriptions. Those experiences matter because inflation is not just an abstract number. It changes real choices, from how families budget to whether businesses can afford to hire more workers.
Unemployment rate data shows how many people in the labor force are jobless and actively seeking work. A simplified formula is:
\[\textrm{Unemployment Rate} = \frac{\textrm{Number of Unemployed}}{\textrm{Labor Force}} \times 100\%\]
If \(8\) million people are unemployed and the labor force is \(160\) million, then the unemployment rate is \(\dfrac{8}{160} \times 100\% = 5\%\).
Unemployment tends to rise during contractions and fall during expansions. Businesses facing lower sales may reduce hours, freeze hiring, or lay off workers. As the economy recovers, firms begin hiring again. Because job changes often happen after production has already slowed or accelerated, unemployment can lag behind other indicators.
Still, the unemployment rate does not tell the whole labor-market story. It excludes people who stop looking for work. That is why economists also watch the labor force participation rate, which measures the share of the population working or actively seeking work. If unemployment falls because discouraged workers give up searching, the labor market may not be as healthy as the headline number suggests.
Looking beyond the unemployment rate
Suppose a town has 1,000 adults. Out of these, 600 are in the labor force, and 30 are unemployed.
Step 1: Calculate the unemployment rate.
\[\frac{30}{600} \times 100\% = 5\%\]
Step 2: Consider a change in job searching.
If 20 unemployed people stop looking for work, they are no longer counted in the labor force.
Step 3: Recalculate.
The new unemployment rate becomes \(\dfrac{10}{580} \times 100\% \approx 1.7\%\).
The unemployment rate looks much better, but the town did not suddenly create many jobs. This is why economists also examine participation and underemployment.
Another important term is underemployment. A person is underemployed when they work fewer hours than they want or hold a job that does not fully use their skills. A college graduate working a few hours a week because they cannot find full-time work may not be counted as unemployed, but the economy is still not using labor efficiently.
Economists also classify unemployment by cause. Cyclical unemployment rises during recessions. Frictional unemployment happens when people are between jobs. Structural unemployment occurs when workers' skills do not match available jobs, such as when automation changes what employers need.
Traditional indicators are powerful, but they do not capture everything. Economists therefore watch many other measures to understand how the economy is functioning.
Consumer confidence measures how optimistic households feel about their financial future. If people are confident, they are more likely to spend money on cars, appliances, travel, or home improvements. If confidence falls, consumers may cut spending, which can slow the economy.
Stock market indexes can reflect investor expectations about future profits and growth. Rising stock prices may suggest optimism, but stock markets do not represent all households equally. Many people own little or no stock directly, so the market can rise even when many families feel financially squeezed.
Housing starts and building permits offer clues about construction and business confidence. Since homes require labor, materials, loans, and household commitment, housing activity can signal future economic momentum. Retail sales show how much consumers are buying. Industrial production tracks factories, mines, and utilities.
Some indicators focus more directly on quality of life. Poverty rates show how many people live below a minimum income threshold. Income inequality examines how evenly or unevenly income is distributed. Productivity measures output per worker or per hour, helping economists see whether efficiency is improving. Environmental indicators, such as air quality or carbon emissions, can also matter because economic growth that damages long-term health and sustainability may not represent true progress.
Some countries complement GDP with broader measures of well-being, including health, education, and life satisfaction. This reflects an important idea in economics: higher output matters, but so does how people actually live.
These non-traditional indicators are especially useful when traditional data looks strong but people's lived experience suggests otherwise. For example, GDP may grow because a technology sector expands rapidly, while many regions still face job losses or high housing costs. Looking at inequality, regional employment, and consumer confidence helps reveal these differences.
[Figure 3] Not all indicators move at the same time. Economists group them by timing. Leading indicators tend to change before the broader economy does. Lagging indicators change after the economy has already started shifting. Coincident indicators move at about the same time as the overall economy.
Examples of leading indicators include stock prices, consumer expectations, new building permits, and some manufacturing orders. Coincident indicators include personal income and current employment levels. Lagging indicators include long-term unemployment and, in many cases, the unemployment rate itself, because businesses may wait before hiring again after a downturn begins to ease.
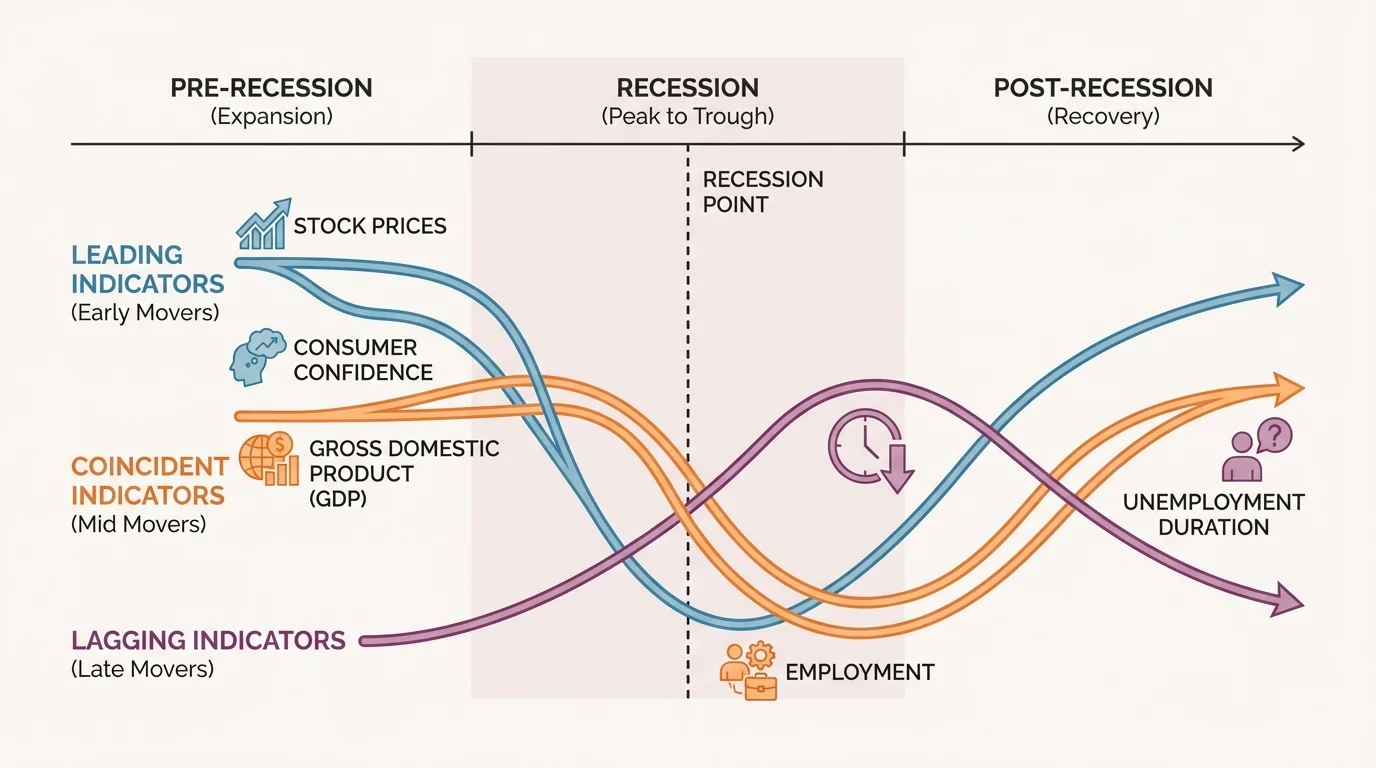
This timing difference matters for policy. If leaders wait until lagging indicators clearly worsen, the recession may already be spreading. But if they react too strongly to early signals that turn out to be false alarms, they could overstimulate the economy. Reading indicators requires judgment, not just calculation.
Later in a recovery, the pattern in [Figure 3] still matters. Confidence or housing activity may improve before unemployment falls much. That can make recoveries feel frustratingly slow, even when some data points have already turned upward.
Governments and central banks use economic indicators to decide whether they should try to stabilize the economy. Fiscal policy involves government spending and taxation. Monetary policy involves managing interest rates and the money supply, usually through a central bank.
During a contraction, the government may increase spending, cut taxes, or both to boost aggregate demand. A central bank may lower interest rates to encourage borrowing and investment. These actions aim to support GDP growth and reduce cyclical unemployment. During periods of high inflation, policymakers may do the opposite by reducing spending growth, raising taxes, or increasing interest rates to cool demand.
Policy trade-off example
Suppose unemployment rises from \(4\%\) to \(7\%\), while inflation falls from \(4\%\) to \(2\%\).
Step 1: Read the indicators.
Higher unemployment suggests weakening economic activity. Lower inflation suggests price pressures are easing.
Step 2: Consider a policy response.
Policymakers may decide there is room to stimulate the economy with lower interest rates or increased public spending.
Step 3: Evaluate the risk.
If policymakers stimulate too much, inflation could rise again later. If they do too little, unemployment may stay high.
Economic policy often involves balancing short-term relief with long-term stability.
These policies affect everyday life. Lower interest rates can make car loans or mortgages cheaper. Higher government spending can create jobs through infrastructure projects. Anti-inflation policies can slow price increases but may also reduce hiring in the short run. That is why debates about policy are not only technical; they also involve values, priorities, and trade-offs.
No policy is perfect. Fiscal policy can be delayed by political disagreement. Monetary policy may take time to affect borrowing, spending, and hiring. Sometimes data is revised later, meaning policymakers were working with incomplete information. Economic stabilization is therefore less like flipping a switch and more like steering a large ship that responds slowly.
Economic data can seem confusing because indicators measure different things, are collected in different ways, and sometimes point in different directions. GDP can rise while real wages stagnate. Unemployment can fall while labor force participation also falls. Inflation can decline from \(8\%\) to \(4\%\), but prices are still increasing, just more slowly than before.
Averages also hide variation. If average income rises, that does not mean everyone's income rises equally. If national unemployment falls, some cities or industries may still struggle. If stock prices climb, households without investments may see little direct benefit. Economists therefore look for patterns beneath the national averages.
Data quality matters too. Initial estimates are often revised. Informal work may be undercounted. New technologies can change buying habits faster than measurement systems adapt. For example, free digital services may improve people's lives in ways that are hard to capture in GDP.
When evaluating any statistic, ask three questions: What does it measure? What does it leave out? How might the business cycle affect it? Those questions help prevent overconfidence in a single headline number.
That habit of questioning is especially important during major shocks. A natural disaster, financial crisis, pandemic, or war can affect supply, demand, labor markets, and prices at the same time. In such moments, no single indicator gives a complete answer.
Economists read the economy by combining indicators into a broader story. If real GDP is growing, unemployment is falling, inflation is moderate, and consumer confidence is rising, the economy is likely expanding in a healthy way. If GDP is slowing, layoffs are increasing, and retail sales are weakening, a contraction may be developing. If growth is strong but inflation is accelerating rapidly, the economy may be overheating.
The key idea is that economic health has many dimensions: output, prices, jobs, expectations, distribution, and sustainability. A strong economy is not simply one that produces a lot. It is also one in which growth is stable, opportunities are broad, prices are reasonably predictable, and the benefits of growth are widely shared.
For students, this way of thinking is powerful because it connects economics to real choices. News reports about jobs, housing, wages, interest rates, and prices are all pieces of the same puzzle. The more carefully you understand the indicators, the better you can judge what is happening in the economy and why people may disagree about it.