Two species can look completely different and still be close relatives. Whales live in the ocean, bats fly through the air, and humans build cities, yet all three are mammals with deep shared ancestry. That idea is powerful, but in science it is not enough to simply say it. Scientists must communicate why it is true, what evidence supports it, and how well that evidence supports the explanation. In biology, some of the most important ideas become convincing only when they are presented in multiple formats: careful writing, spoken explanation, visuals, and numerical analysis.
Scientific communication is more than giving facts. It is the process of turning observations and data into explanations that other people can understand, question, and test. A strong scientific communication product does not just contain information; it is designed for a specific purpose. It should make the main claim clear, present accurate evidence, and match the audience. A research paper, a classroom presentation, a graph, and a museum display may all explain the same evolutionary idea, but each uses a different format to make the evidence accessible.
Science depends on shared evidence. If one biologist studies fossils, another compares DNA, and another tracks changes in living populations, their findings become much more useful when they are communicated clearly. Scientific ideas gain strength when different investigators can understand the evidence, compare conclusions, and reproduce methods. That is especially important for topics such as evolution, where conclusions are based on large bodies of evidence collected over time.
There are four major communication formats emphasized here, and [Figure 2] later provides an example of how evolutionary relationships can be shown visually. Textual communication uses written explanations, captions, and reports. Oral communication includes presentations, discussions, and interviews. Graphical communication uses diagrams, charts, maps, and tree diagrams. Mathematical communication uses measurements, percentages, ratios, and patterns in data. In real science, these formats often work together rather than separately.
Common ancestry means that different species descended from shared ancestral populations in the past.
Biological evolution is the change in the inherited characteristics of populations over generations.
Empirical evidence is evidence based on observation, measurement, and data collected from the natural world.
When scientists communicate about evolution, they usually organize ideas using a structure called claim, evidence, and reasoning. The claim is the statement being supported. The evidence is the data or observations. The reasoning explains how the evidence supports the claim using scientific concepts. For example, a claim might state that birds and certain dinosaurs share common ancestry. The evidence could include fossil features, bone structure, and genetic data from modern birds. The reasoning would explain that these shared traits are best accounted for by descent from a common ancestor.
A central idea in modern biology is that life shows both unity and diversity. The unity appears in features shared across organisms, such as the universal genetic code, the use of DNA, and many common biochemical pathways. The diversity appears in the enormous range of body forms, behaviors, and habitats found across life on Earth. Evolution explains both patterns: organisms share basic features because of common ancestry, and they differ because populations change over long spans of time.
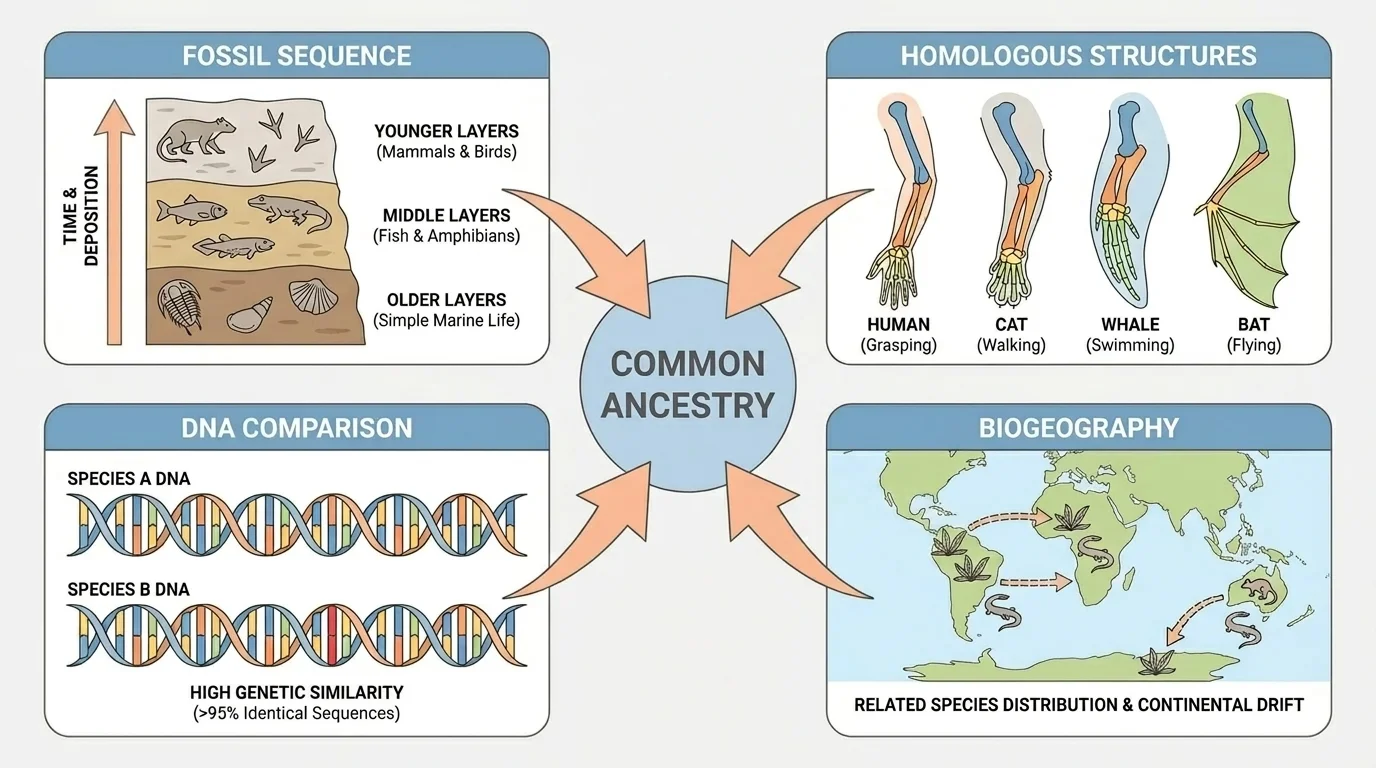
Scientists do not rely on a single type of observation to support this idea. Instead, they test whether many independent lines of data point toward the same conclusion. This is one reason evolution is such a strong scientific explanation. As [Figure 1] shows, fossils, anatomy, molecular comparisons, and geographic distribution can all support the same broader claim about shared ancestry even though they come from different methods of investigation.
It is also important to distinguish between evidence of evolution and mechanisms of evolution. Evidence answers the question, "How do we know populations have changed and species are related?" Mechanisms answer the question, "How do those changes happen?" Mechanisms include natural selection, mutation, genetic drift, and gene flow. In communication, mixing these ideas can confuse an audience, so scientists often separate them clearly.
The fossil record preserves organisms and traces of organisms from the past. Fossils do not form for every organism, but the fossils that do exist reveal change over time and transitional forms between major groups. In horse evolution, for example, fossils show changes in body size, tooth structure, and toe number across millions of years. These changes are not random isolated snapshots; together they form a pattern of descent with modification.
Homologous structures are body parts in different species that share a similar underlying form because they were inherited from a common ancestor. The forelimbs of humans, cats, whales, and bats all contain corresponding bones even though they perform different functions. This pattern strongly supports common ancestry because the similarities are structural, not just superficial. Several major lines of evidence converge on this conclusion, with different kinds of data pointing toward the same central idea.
Comparative embryology studies similarities in early development. Embryos of vertebrates share features at certain stages, such as tails and pharyngeal pouches, because they inherited developmental patterns from shared ancestors. These early similarities do not mean embryos are identical, but they show deep biological relationships.
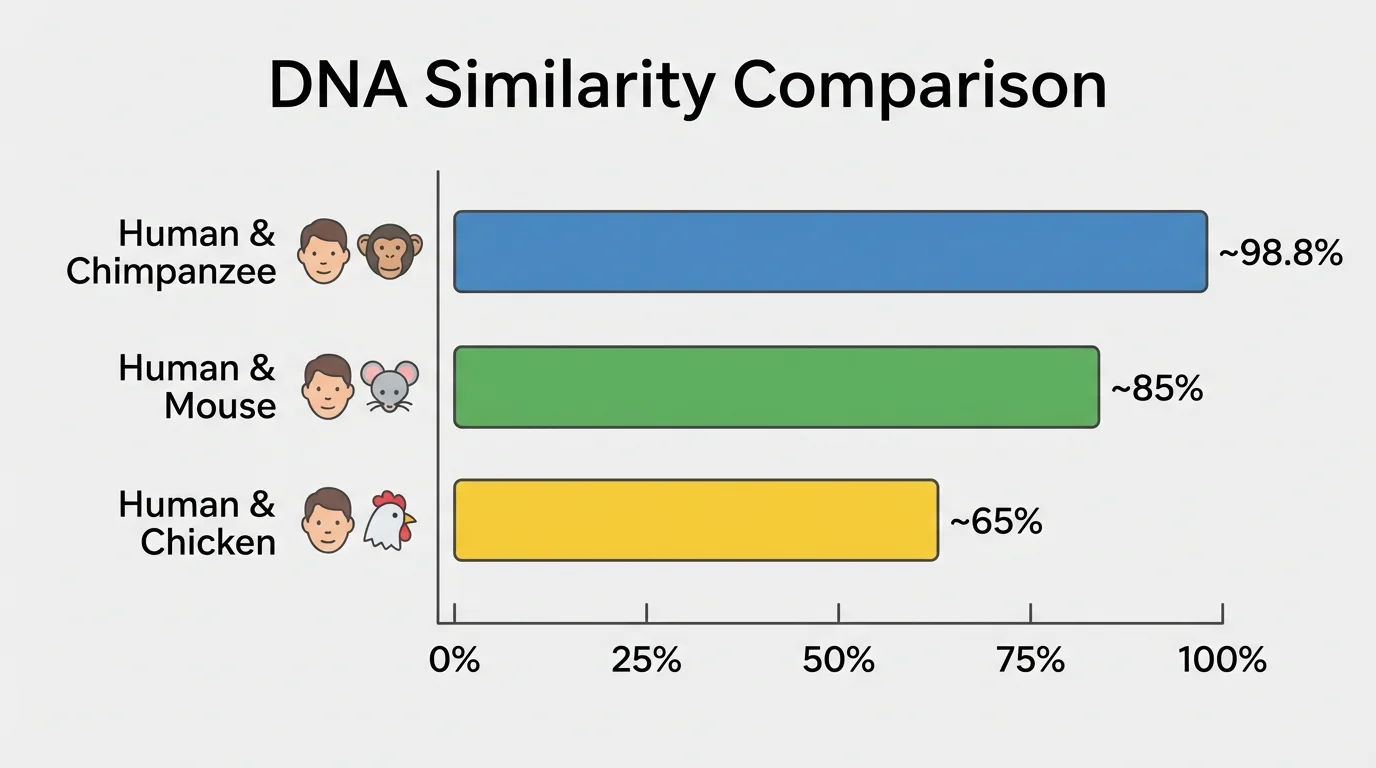
Molecular evidence comes from DNA, RNA, proteins, and the genetic code itself. All known organisms use DNA to store hereditary information, and many genes are shared across species. When scientists compare DNA sequences, species that are more closely related usually have more similar sequences. For example, humans and chimpanzees share a very high percentage of DNA sequence similarity, which supports the conclusion that they share a more recent common ancestor than either does with chickens.
Biogeography is the study of the geographic distribution of organisms. It explains why species on islands often resemble species from the nearest mainland, and why isolated landmasses develop distinctive groups of organisms. Marsupials are especially diverse in Australia because their evolutionary history was shaped by geographic isolation. Biogeographic patterns make sense when species spread, diverged, and adapted over time.
Scientists also observe evolution directly in modern populations. Bacteria evolve resistance to antibiotics. Insects evolve resistance to pesticides. Viruses accumulate mutations that allow researchers to track their lineages. These modern examples are especially useful in communication because they show that evolution is not only a historical claim about the distant past. It is an ongoing process that can be measured today.
Some whale fossils still preserve tiny hind limb bones. These structures help connect modern whales to land-dwelling ancestors and provide a striking example of how anatomy and fossils support the same evolutionary story.
Notice how the strongest scientific explanations do not depend on one dramatic example. A single fossil can be important, but the broader conclusion comes from multiple independent lines of empirical evidence. That is the big communication challenge: presenting many sources of support without overwhelming the audience.
Written scientific communication should be precise, evidence-based, and organized. A strong paragraph on evolution often begins with a clear claim, follows with evidence, and then explains the reasoning. Vague statements such as "animals changed because they had to" are not scientifically accurate. Better wording would say that populations changed over generations because individuals with certain heritable traits survived and reproduced more successfully in a given environment.
Word choice matters. In everyday speech, people may use "theory" to mean a guess, but in science a theory is a well-supported explanatory framework. In the same way, "adaptation" should not be used to mean any change at all. An adaptation is a heritable trait that increases reproductive success in a particular environment. Precise language helps prevent misunderstandings.
Example of stronger scientific writing
Weak statement: "Whales are related to land mammals because they look somewhat similar."
Stronger statement: "Whales and land mammals share common ancestry, supported by homologous bone patterns, fossil evidence of transitional forms, and molecular comparisons showing close relationships among mammalian lineages."
Audience matters too. A report for biologists can use technical vocabulary and assume background knowledge. A presentation for the general public should define key terms and avoid unnecessary jargon. Good scientific communication does not water down the evidence; it adjusts the explanation so the audience can follow it accurately.
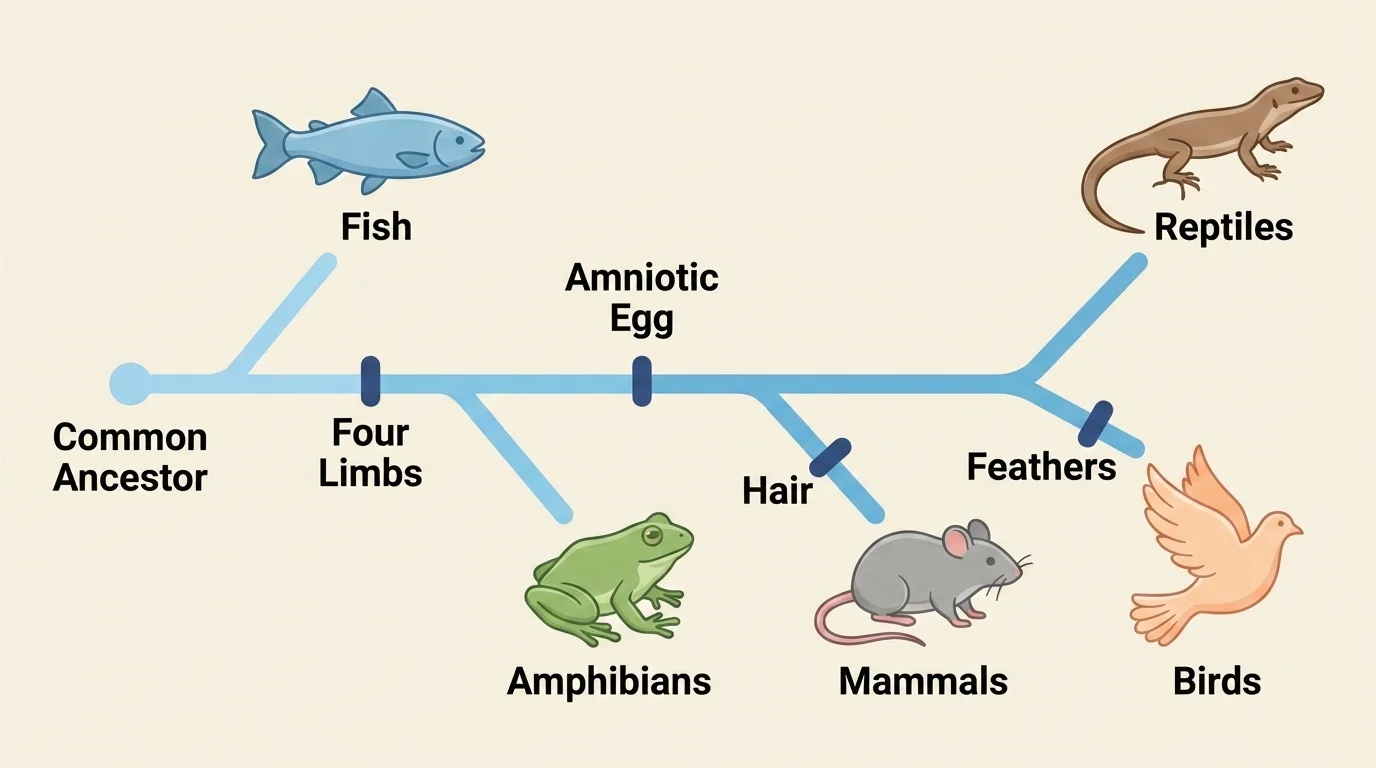
Visual formats are often the fastest way to reveal patterns in biological data. A cladogram is a branching diagram that represents hypotheses about evolutionary relationships. Each branch point indicates a common ancestor, and traits can be mapped along branches to show when they likely evolved.
To read a cladogram correctly, focus on branching order rather than left-to-right appearance. Two species are more closely related if they share a more recent branch point. Students sometimes make the mistake of thinking the species at the far right is "most evolved." That is incorrect. All living species have been evolving for the same amount of time since their last common ancestors.
Other graphical tools include comparison charts, timelines of fossil appearance, maps of species distribution, and labeled anatomical diagrams. For example, a chart comparing vertebrate forelimb bones can make homology easier to see than a paragraph alone. A map of island species can quickly highlight the importance of isolation in biogeography. As students become stronger communicators, they learn not only to read these visuals but also to decide which visual best matches the evidence.
A good figure needs a clear title or caption, accurate labels, and data presented honestly. Distorted scales, missing labels, or decorative images with no explanatory value weaken communication. In science, visuals are not just added for style. They are evidence-bearing tools.
Later, when explaining shared ancestry, the branching pattern remains useful because it shows how one diagram can summarize both unity and diversity at the same time.
Numbers make evolutionary relationships more precise. Quantitative comparisons can show how similar DNA sequences are, how allele frequencies change in a population, or how trait frequencies shift over generations. A visual summary of such comparisons appears in [Figure 3], where percentage similarity helps communicate relatedness more clearly than words alone.
One simple mathematical tool is percent similarity. If two DNA sequences match at many positions, scientists can communicate that relationship numerically. The formula is
\[\textrm{percent similarity} = \frac{\textrm{number of matching positions}}{\textrm{total positions compared}} \times 100\]
Suppose two species have matching DNA bases at \(94\) out of \(100\) positions. Then the percent similarity is \(\dfrac{94}{100} \times 100 = 94\%\). That number does not prove ancestry by itself, but it becomes powerful when combined with other evidence.
Worked example: DNA similarity
A student compares a gene sequence from Species A and Species B. Out of \(250\) positions, \(235\) are the same. Find the percent similarity and explain what it suggests.
Step 1: Write the formula
\[\textrm{percent similarity} = \frac{\textrm{matching positions}}{\textrm{total positions}} \times 100\]
Step 2: Substitute the values
\[\textrm{percent similarity} = \frac{235}{250} \times 100\]
Step 3: Calculate
\[\frac{235}{250} = 0.94\]
\[0.94 \times 100 = 94\%\]
The sequences are \(94\%\) similar. This suggests the species are likely relatively closely related compared with species that share a much lower percentage for the same gene.
Another useful quantitative measure is allele frequency, the proportion of a specific allele in a population. If an allele appears \(30\) times in a sample of \(100\) total alleles, its frequency is \(\dfrac{30}{100} = 0.30\), or \(30\%\). If that frequency changes over time, scientists can communicate evolution mathematically because, in population genetics, evolution is defined as a change in allele frequencies across generations.
Mathematics can also compare rates. For example, if a resistant bacterial strain rises from \(10\%\) of a population to \(70\%\) after several generations of antibiotic exposure, the increase is \(70\% - 10\% = 60\) percentage points. That simple calculation helps show how strong selection can rapidly shift a population.
The numerical comparisons in [Figure 3] are most meaningful when paired with fossil, anatomical, and geographic evidence. In science, numbers rarely stand alone; they become persuasive when interpreted in context.
Oral scientific communication includes class presentations, conference talks, interviews, debates, and explanations during lab work. Speaking well in science means more than sounding confident. It means stating a claim clearly, guiding the audience through evidence, and explaining how the evidence supports the conclusion. A good speaker also anticipates questions and avoids exaggeration.
For an oral explanation of common ancestry, an effective sequence might be: begin with the claim, define key terms, present two or three major lines of evidence, and close by explaining why independent evidence strengthens the conclusion. Good oral communication also depends on transitions. Phrases such as "A second line of evidence comes from molecular biology" help listeners follow the structure.
Good scientific speaking still depends on the same core structure used in writing: claim, evidence, and reasoning. Speaking changes the delivery format, not the logic.
Tone matters. Scientific oral communication should be respectful, evidence-based, and open to revision if better evidence appears. That attitude reflects how science works. Scientists are not expected to defend ideas stubbornly; they are expected to support ideas with data and revise conclusions when necessary.
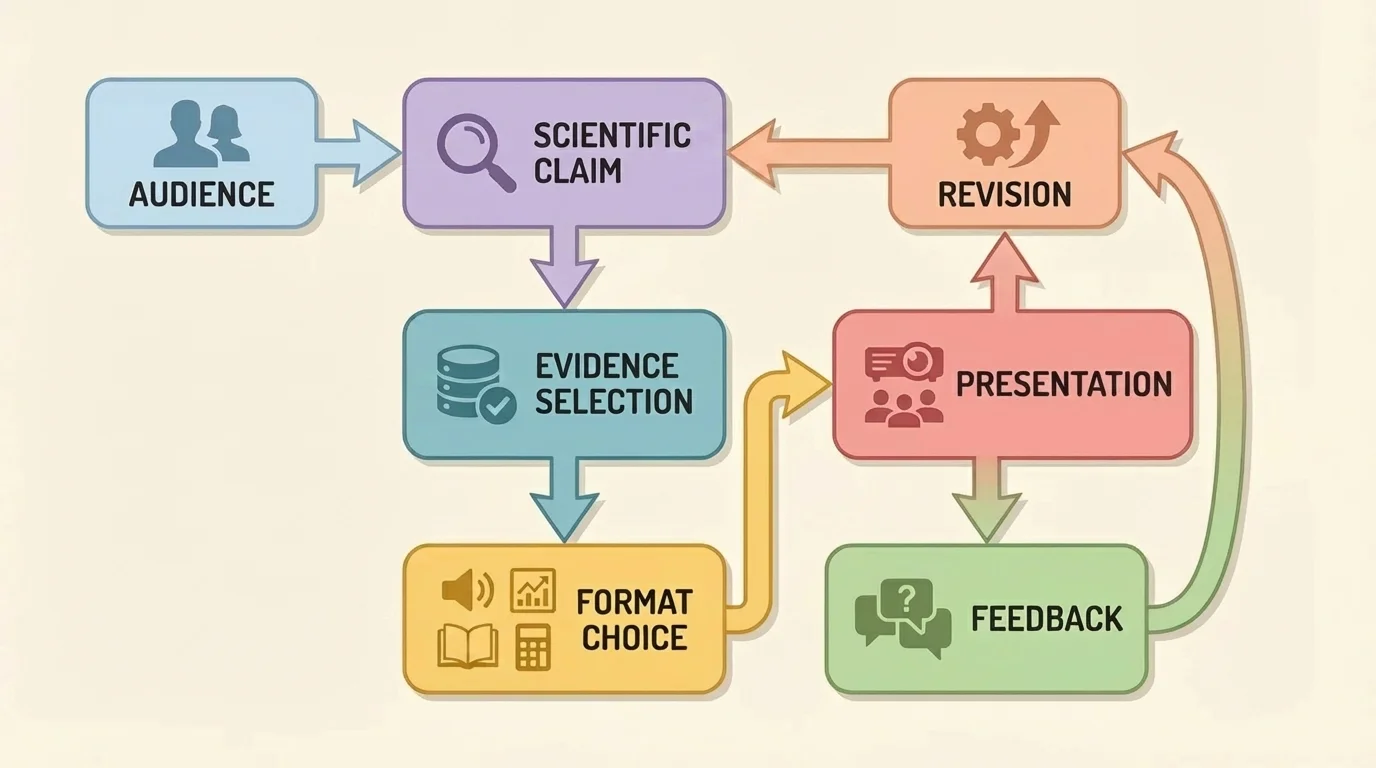
A scientific explanation can be treated as a designed system, and [Figure 4] later shows this communication workflow. It has an input, such as data from fossils or DNA analysis; a process, such as selecting evidence and choosing a format; and an output, such as a report, graph, or presentation. It also has feedback, because audiences ask questions, identify confusion, or suggest improvements. This process highlights that communication can be evaluated and revised like other technical systems.
To judge the performance of a communication product, ask several questions. Is the claim accurate and specific? Is the evidence relevant and sufficient? Are the visuals clear and correctly labeled? Is the mathematical information accurate? Is the explanation understandable for the intended audience? A beautifully designed slide deck that includes misleading claims or visuals is a poor scientific product. On the other hand, a scientifically accurate explanation that is disorganized may fail to communicate effectively.
Scientists often improve communication through revision. A graph may need a better scale. A written paragraph may need clearer reasoning. A presentation may need fewer details on one slide and more explanation on another. This is not a sign of weakness. It is part of scientific practice.
| Format | Strength | Limitation | Best use in evolution |
|---|---|---|---|
| Text | Detailed explanation | Can feel dense | Claim-evidence-reasoning paragraphs |
| Oral | Immediate interaction | Information passes quickly | Presentations and discussion |
| Graphical | Shows patterns fast | Can be misread without labels | Cladograms, fossil sequences, anatomy diagrams |
| Mathematical | Adds precision | Needs interpretation | DNA similarity, frequency change, population data |
Table 1. Comparison of major communication formats used to explain evidence for evolution.
When students learn to evaluate communication in this way, they are doing more than learning biology content. They are learning how scientific knowledge is built, tested, and shared.
When revising a report or presentation, this workflow remains useful because it reminds us that audience, evidence choice, and feedback all affect the final quality of the communication product.
These communication skills matter far beyond the classroom. In medicine, researchers communicate the evolution of viruses to guide vaccine updates. In agriculture, scientists explain how pesticide resistance develops in insect populations and recommend strategies to slow it. In conservation biology, researchers communicate how isolated populations lose genetic diversity and why habitat corridors matter. In each case, the science must be accurate, but it also must be understandable to decision-makers and the public.
Evolutionary communication also matters in biotechnology. When scientists compare genes across species, they often use evolutionary relationships to infer gene function. A quantitative report showing sequence similarity, combined with a diagram of related species and a written explanation of molecular conservation, helps other researchers decide whether a gene found in one organism is likely to play a similar role in another.
Why multiple formats are stronger than one
A written paragraph can explain a claim, a cladogram can reveal relationships visually, and a percentage comparison can make relatedness measurable. When these formats agree, the communication becomes more convincing because the audience can check the same idea from different angles.
Public understanding of evolution is also shaped by communication quality. Misleading graphics, imprecise wording, or unsupported claims can spread confusion quickly. Clear scientific communication helps people distinguish evidence-based explanations from opinion. That is one reason learning to communicate science is itself a scientific skill, not just an add-on.
"Nothing in biology makes sense except in the light of evolution."
— Theodosius Dobzhansky
The best scientific communicators do something subtle but powerful: they preserve complexity without creating unnecessary confusion. They can explain that evolution is supported by fossils, homologous structures, embryology, molecular comparisons, biogeography, and observed change in modern populations, while also choosing the right format for the audience and purpose.