Suppose two brands of paper towel both claim they are "super absorbent." How could you find out which one really absorbs more water? You could not just squeeze each one once and guess. You would need a careful plan, clear measurements, and recorded results. That is what scientists do when they carry out an investigation. They collect data that can be used as evidence, and that evidence helps answer a question.
A investigation is a planned way to learn something by observing, measuring, testing, and recording results. In science, an investigation is not just "trying something out." It has a goal. The goal might be to compare, describe, test, or explain something in the world.
Scientists and students investigate many kinds of questions. A class might test which soil holds the most water. A doctor might investigate whether a medicine helps patients recover faster. A sports company might test which shoe sole grips a gym floor best. In every case, the investigation must produce data that can be used as evidence.
Data are the facts and information collected during an investigation. Evidence is the data used to support a claim or conclusion. Observation means noticing and describing something using your senses or tools.
Not all data look the same. Some data are words, such as "the liquid turned cloudy" or "the leaf edges became brown." Some data are numbers, such as the temperature being \(24 \textrm{ °C}\) or the plant height being \(15 \textrm{ cm}\). Both can be useful, but the data must match the goal of the investigation.
A strong investigation starts with a clear question. The question should be specific enough to answer. "Which paper towel absorbs the most water?" is much better than "How do paper towels work?" A clear question helps you decide what to test and what data to collect.
Every investigation also needs a goal. The goal tells what you are trying to find out. If the goal is to compare absorbency, then the data should measure how much water each paper towel absorbs. If the goal is to compare speed of dissolving, then the data should measure time, such as \(45 \textrm{ s}\) or \(60 \textrm{ s}\).
Good investigations often include these parts:
To be useful, data must be connected to the question. If you are testing plant growth, recording the color of the flowerpot may not help. But recording the height of the plants each week probably will. That means planning is important before the investigation begins.
You already know how to measure length, mass, time, and volume with tools such as rulers, balances, timers, and measuring cups or graduated cylinders. Investigations build on those skills by using measurements in a planned, organized way.
Another important idea is that investigations should be as fair as possible. If too many things change at once, it becomes hard to know what caused the result. That is why scientists pay close attention to variables, as [Figure 1] shows.
Planning means thinking ahead so the investigation can produce good evidence. Before starting, ask: What question am I trying to answer? What materials do I need? What will I measure? How often will I measure it? How will I record my data?
Safety is part of planning too. Even a simple classroom investigation should be done safely. If water is spilled, the floor could become slippery. If glass is used, it could break. If heat is involved, extra care is needed. A good plan includes safe handling of materials and clear directions.
You should also decide whether your data will be qualitative data or quantitative data, or both. Qualitative data describe qualities, such as color, smell, texture, or appearance. Quantitative data are numbers that can be measured or counted.
For example, if you investigate melting ice cubes in different places, qualitative data might include "the cube in sunlight became rounded at the edges." Quantitative data might include "the cube melted in \(18 \textrm{ min}\)." Often, the best investigations use both kinds because they give a fuller picture.
Planning matches the goal
The best way to collect data depends on the goal of the investigation. If the goal is to compare two objects, you need data that can be compared fairly. If the goal is to describe a change over time, you need repeated observations at regular times. If the goal is to find a pattern, you need enough data to notice the pattern clearly.
Planning also includes deciding how many times to repeat the test. One trial might be unusual by chance. Repeating helps you see whether the same result happens again.
In a fair test, only one main factor is changed at a time. This lets you tell which factor may have caused changes in the results. A factor that can change in an investigation is called a variable.
There are three important kinds of variables. The independent variable is the one you change on purpose. The dependent variable is the one you measure or observe because it may respond to the change. Controlled variables are the things you keep the same so the test stays fair.
Think about testing how sunlight affects plant growth. If the amount of sunlight is changed, then sunlight is the independent variable. Plant height might be the dependent variable. The type of plant, amount of water, size of pot, and kind of soil should stay the same, so they are controlled variables.
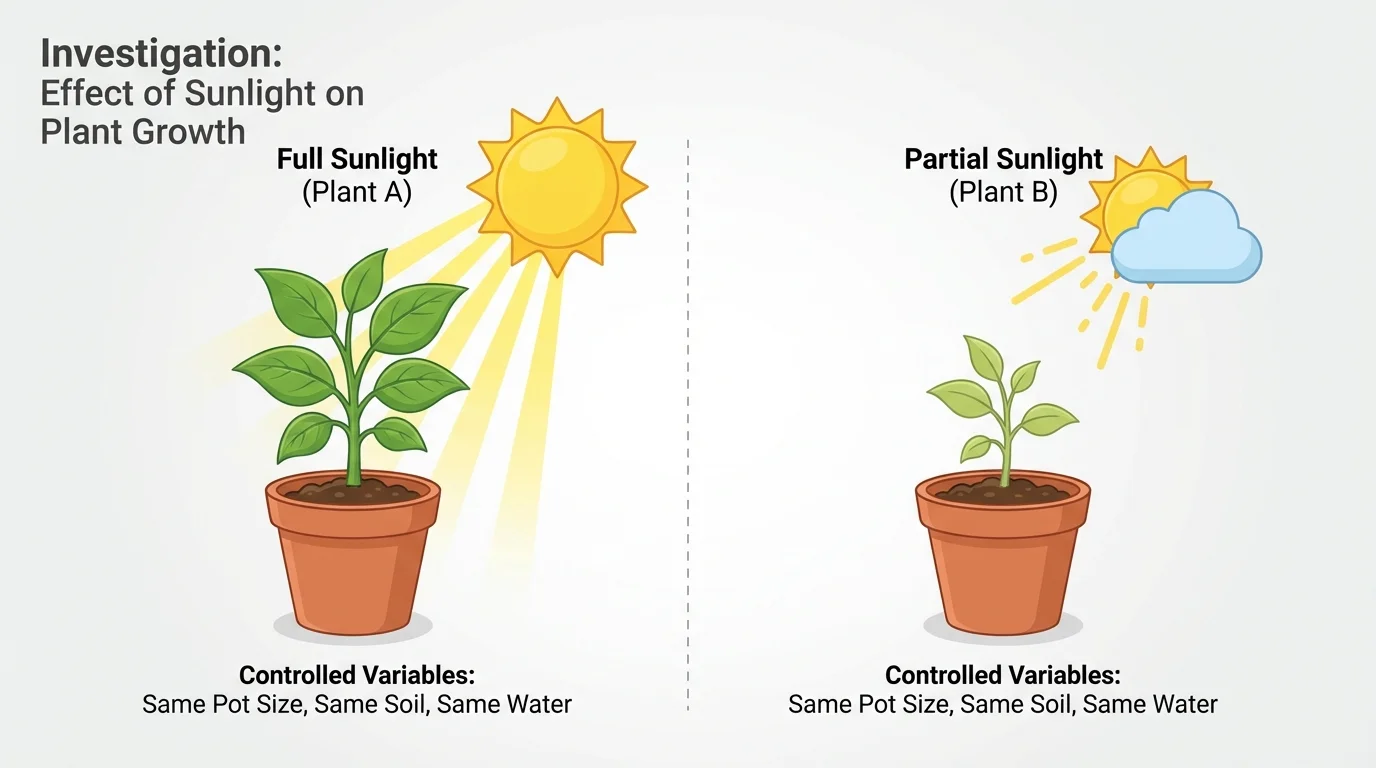
If you changed sunlight, water, and soil all at once, you would not know which one caused the difference. Fair testing makes evidence stronger because it helps connect the results to one specific cause.
This idea appears in real life too. If a basketball player tries new shoes, changes training time, and changes diet during the same week, it is hard to know which change improved performance. Scientists try to avoid that confusion by controlling as many variables as possible.
Some scientific investigations are not experiments with one changed variable. Scientists also do observational investigations, such as recording bird visits at different times of day. Even then, they still plan carefully so their data fit the question.
Fair tests are especially useful when the goal is to compare products, materials, or conditions. The clearer the control, the more trustworthy the data become.
Good evidence depends on careful data collection. Sloppy measuring or missing records can weaken an investigation, even if the question is excellent.
Use the right tool for the measurement. A ruler is useful for length. A timer is useful for time. A balance is useful for mass. A measuring cup or graduated cylinder is useful for volume. Tools should be used correctly and with the same units each time, such as \(\textrm{cm}\), \(\textrm{g}\), \(\textrm{s}\), or \(\textrm{mL}\).
Suppose one student records water as \(50 \textrm{ mL}\) and another records \(0.05 \textrm{ L}\). These amounts are equal, but mixed units can make data harder to compare. Keeping the same unit throughout the investigation makes the records clearer.
Repeated trials are important because results can vary. Maybe one paper towel was folded differently, or one sample was squeezed harder. If you test each brand several times, you get a better picture of its usual performance.
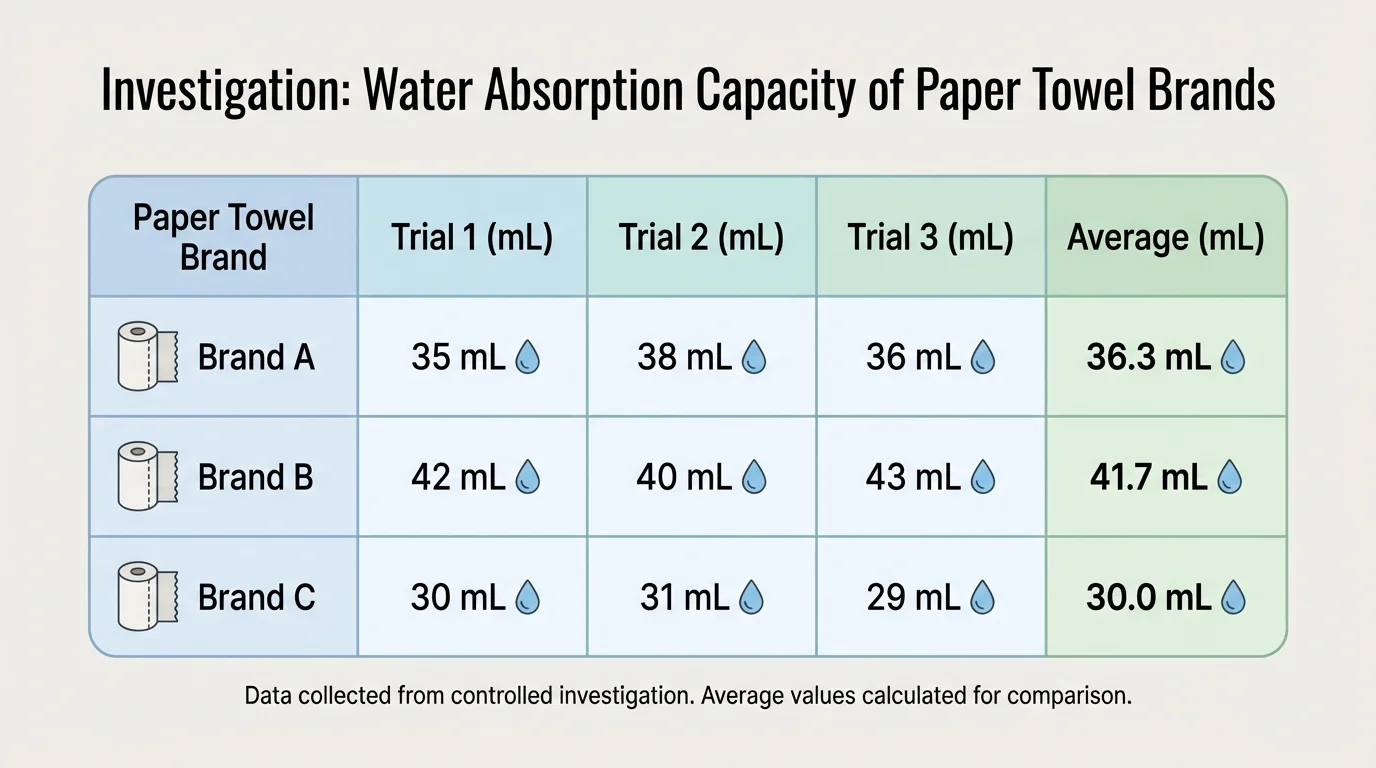
Scientists often organize results in tables, as [Figure 2] shows. A data table can include the item tested, each trial result, and notes. This makes the investigation easier to check and easier to understand later.
There are also two big ideas behind good data: accuracy and precision. Accuracy means how close a measurement is to the true value. Precision means how close repeated measurements are to one another. At this level, the most important point is to measure carefully and consistently.
Honest recording matters too. Scientists do not change numbers just because they do not like the result. A surprising result can be important. Data should be written down as they are observed.
Let us look at a full example. Suppose the question is: Which paper towel brand absorbs the most water? The setup uses equal-size samples, a measuring container, and the same testing steps for each brand. This investigation works well because the question is clear and the data can be measured.
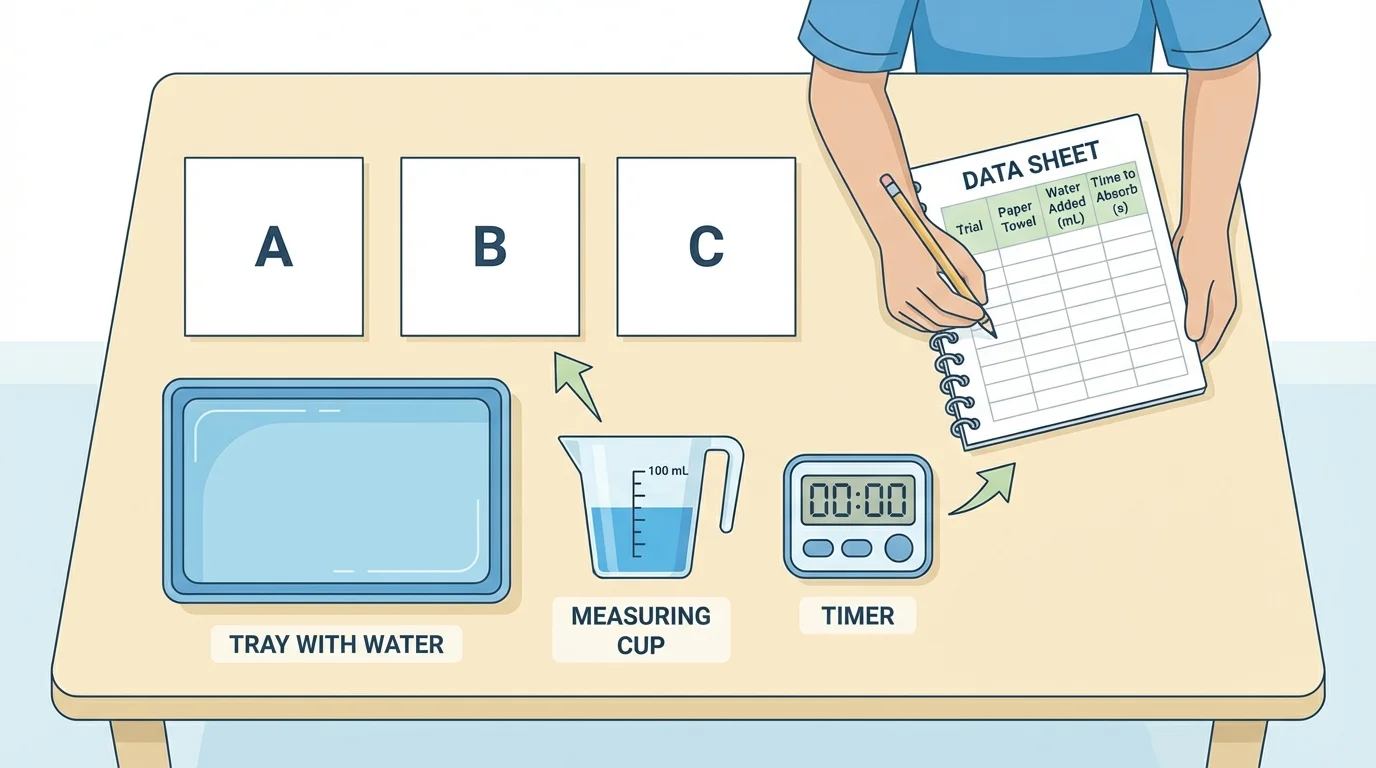
The independent variable is the paper towel brand. The dependent variable is the amount of water absorbed. Controlled variables include the size of each paper towel piece, the amount of time it sits in the water, the amount of pressure used when lifting it, and the measuring method, as shown in [Figure 3].
Case study: planning the investigation
Step 1: Choose materials
You need three brands of paper towel, scissors, water, a tray, a measuring cup, and a chart for recording results.
Step 2: Make the test fair
Cut each paper towel into equal squares. Use the same size for every sample. Pour the same amount of water into the tray for each trial.
Step 3: Decide how to measure
Measure how much water is absorbed in milliliters. Test each brand three times.
Step 4: Record observations
Write down number results and also note things such as whether the towel tears, sags, or keeps its shape.
Suppose the class gets these results:
| Brand | Trial \(1\) | Trial \(2\) | Trial \(3\) |
|---|---|---|---|
| A | \(18 \textrm{ mL}\) | \(20 \textrm{ mL}\) | \(19 \textrm{ mL}\) |
| B | \(15 \textrm{ mL}\) | \(14 \textrm{ mL}\) | \(16 \textrm{ mL}\) |
| C | \(21 \textrm{ mL}\) | \(22 \textrm{ mL}\) | \(20 \textrm{ mL}\) |
Table 1. Water absorbed by three paper towel brands across three trials.
These data are quantitative because they use numbers. If students also wrote "Brand B tore when lifted," that would be qualitative data.
Because the investigation uses repeated trials and controlled variables, the data are more useful than a single quick test. The same careful thinking would help in many other investigations, such as testing melting speed, plant growth, or strength of materials.
Once data have been collected, the next job is to look for patterns. A graph can help with this. Patterns help turn raw data into evidence.
One way to compare repeated trials is to find the average. For Brand A, the total absorbed is \(18 + 20 + 19 = 57\). The average is \(57 \div 3 = 19\), so Brand A absorbs \(19 \textrm{ mL}\) on average.
For Brand B, the total is \(15 + 14 + 16 = 45\). The average is \(45 \div 3 = 15\), so Brand B absorbs \(15 \textrm{ mL}\) on average.
For Brand C, the total is \(21 + 22 + 20 = 63\). The average is \(63 \div 3 = 21\), so Brand C absorbs \(21 \textrm{ mL}\) on average.
Now the evidence is easier to state clearly: Brand C absorbed the most water in all three trials and also had the highest average, as [Figure 4] shows. That makes a strong claim because the evidence is based on repeated measurements, not just opinion.
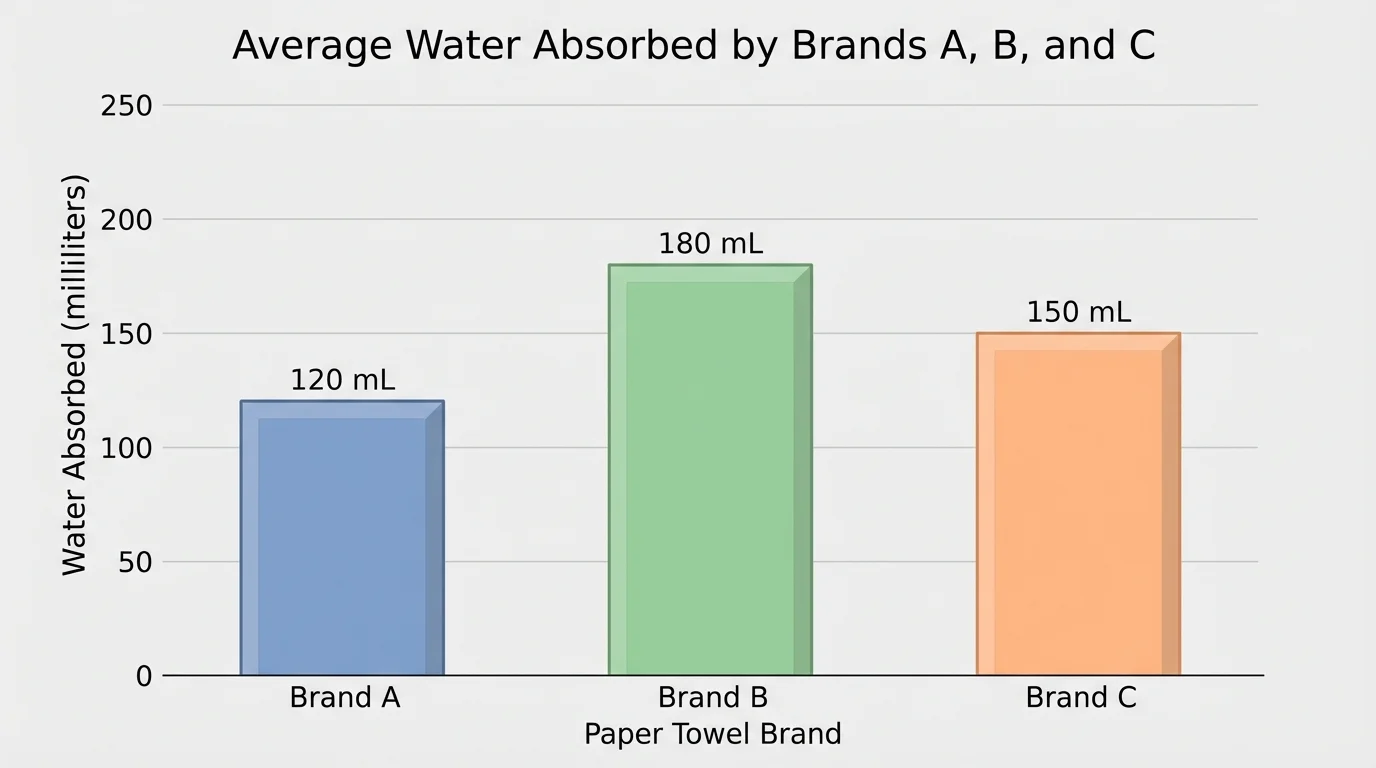
Evidence should lead to a claim that matches the data. A good claim might be: "Brand C was the most absorbent paper towel in this investigation." That claim is limited to what was tested. It does not prove Brand C is best in every possible situation, but it does answer the investigation question.
Notice how the fair-test idea from [Figure 1] matters here too. If the paper towel pieces had not been the same size, the graph in [Figure 4] would not mean much, because the comparison would not be fair.
Claims, evidence, and reasoning
Scientists often connect ideas in three parts: a claim, the evidence that supports it, and the reasoning that explains why the evidence fits the claim. For example, the claim is that Brand C absorbs the most water. The evidence is the set of trial results and averages. The reasoning is that the same-size samples were tested in the same way, so the higher measurements show greater absorbency.
Sometimes patterns are not as clear. Results may be very close, or one trial may be very different from the others. In those cases, scientists may repeat the investigation or improve the procedure.
No investigation is perfect. Sometimes tools are hard to read. Sometimes a sample is damaged. Sometimes a person forgets a step. These problems can affect the data. Scientists call these possible problems sources of error.
A source of error is not the same as "making everything wrong." It means something may have influenced the results. For example, if one paper towel sample was larger than the others, it might absorb more water just because of its size. If the tray had different amounts of water each time, that would also affect the results.
Improving an investigation might mean adding more trials, using better measuring tools, writing clearer directions, or controlling variables more carefully. Scientists often revise their methods because science grows stronger when methods improve.
Improving the paper towel investigation
Step 1: Find a weakness
Suppose students realize they lifted one brand more slowly, giving it extra time to drip.
Step 2: Change the procedure
They decide every sample will be lifted after exactly \(5 \textrm{ s}\) and held above the tray for exactly \(2 \textrm{ s}\).
Step 3: Repeat the test
They run the trials again and compare the new data with the old data.
Being honest about weak spots is part of real science. A scientist does not hide mistakes. Instead, the scientist explains what happened and works to improve the evidence.
Investigations are not only for science class. Farmers investigate which growing methods help crops best. Doctors investigate how treatments affect health. Engineers investigate which materials are strongest or safest. Weather scientists investigate patterns in temperature, wind, and rainfall to make forecasts.
Companies also investigate products before selling them. A backpack company may test how much weight a strap can hold. A food company may test which package keeps food freshest. A toy designer may test which shape rolls fastest down a ramp. In each case, data are collected for a goal, and the results guide decisions.
The same ideas from the paper towel example still apply in these jobs: ask a clear question, plan the test, control variables, measure carefully, repeat trials, and use evidence to make a conclusion. The organized data table in [Figure 2] and the setup in [Figure 3] represent the kind of careful work scientists and engineers depend on.
"Science is a way of thinking much more than it is a body of knowledge."
— Carl Sagan
When you conduct an investigation well, you are doing more than collecting numbers. You are building evidence that can answer a question in a trustworthy way. That is one of the most powerful skills in science.