Have you ever wondered why two people can test the same question and get different answers? One student might say a plant grows best by a window, while another says it grows fine on a shelf. The difference is often not the plant. It is the experimental design of the investigation. In science, answers are only as strong as the evidence used to support them. That means a scientist must plan carefully, carry out the test fairly, and examine whether the experiment was designed well enough to reach the goal.
When scientists investigate, they are not just "doing an experiment." They are trying to answer a specific question by gathering data. Data are the facts, measurements, and observations collected during an investigation. Good data can be used as evidence. Weak data may lead to conclusions that are uncertain or wrong.
An investigation begins with a question and a goal. The goal tells what the investigation is supposed to find out. For example, a class might ask, "Does the amount of sunlight affect how tall bean plants grow?" The goal is to collect evidence to determine whether sunlight changes plant growth. Every part of the design should help answer that question.
Investigation is a planned way to answer a scientific question by making observations, collecting data, and looking for evidence.
Experimental design is the plan for how an experiment will be carried out so the data collected can answer the question fairly and clearly.
Evidence is the information from data and observations that supports a conclusion.
Scientists often test ideas about materials, motion, light, living things, weather, and many other topics. Even at school, when you test paper airplanes, plant seeds, or magnets, you are learning how science works. The important part is not only what happens. As [Figure 1] will show, the important part is whether the investigation was designed to give useful evidence.
A scientific investigation helps us move from guessing to knowing. People can make predictions, but science checks those predictions with evidence. If you think cold water freezes faster than warm water, you need a fair test. If you want to know which paper towel absorbs the most water, you must compare them in the same way.
Careful investigations matter in everyday life. Doctors test medicines. Engineers test materials for bridges. Farmers test which growing conditions help crops. Even sports scientists test which training plans improve speed or strength. In each case, the question is important, but the design of the test is just as important.
Some famous discoveries happened because scientists noticed that results did not fit what they expected. Unexpected data can be valuable, but only if the investigation is careful enough to show that the pattern is real.
For students, learning to investigate means learning how to ask good questions, how to gather trustworthy data, and how to decide whether the experiment really tested what it was supposed to test.
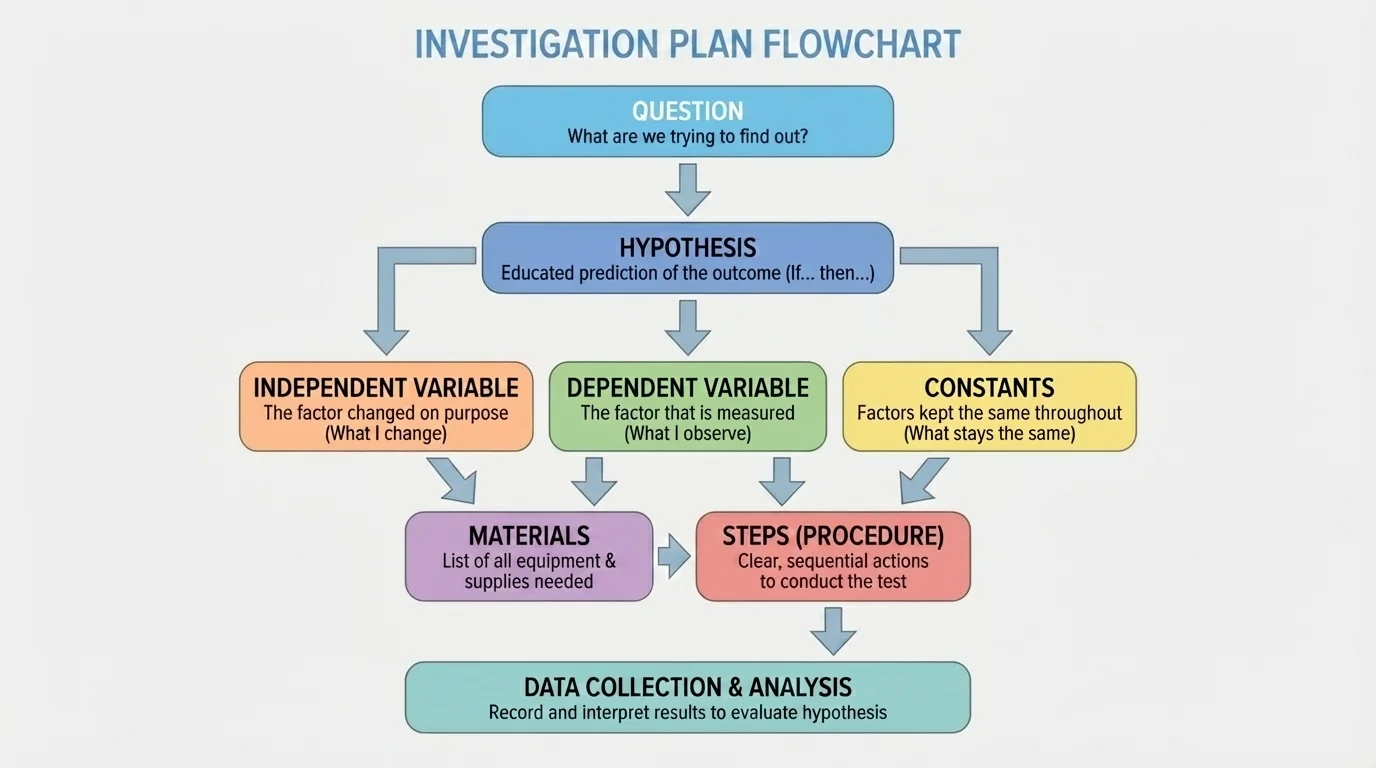
A strong investigation has several connected parts. First, there is the question. Then there is a possible answer or prediction, often called a hypothesis. After that, the investigator decides what will be changed, what will be measured, and what must stay the same.
The first important term is the independent variable. This is the one factor that is changed on purpose. In a plant investigation, it might be the amount of sunlight. The next term is the dependent variable. This is what is measured to see the effect of the change. In the same investigation, the dependent variable might be plant height.
Another important idea is controlled variables, sometimes called constants. These are the things that stay the same so the test is fair. If one plant gets more sunlight but also more water, then the investigation does not clearly show what caused the difference. To keep the test fair, the type of plant, soil, water, and pot size should stay the same.
A fair test changes only one main factor at a time while keeping other important factors the same. This helps scientists determine what caused the results. If too many things change, the evidence becomes confusing.
Materials and procedure also matter. The materials list tells what tools and objects are needed. The procedure gives clear steps for what to do. A strong procedure is detailed enough that another person could repeat the investigation in the same way. When scientists can repeat a test and get similar results, confidence in the evidence grows.
Suppose a class wants to know whether cold or warm water dissolves sugar faster. As shown in [Figure 2], a fair design would use the same amount of water, the same type of cup, the same amount of sugar, and the same stirring method. Only the water temperature should change. That makes the evidence much stronger.
Planning is not only about what to do. It is also about what data to collect and how to collect it. Organized data, like a table, help scientists compare results, notice patterns, and avoid forgetting important measurements. Before starting, the investigator should decide what will be measured, what tools will be used, and how often measurements will be taken.
Measurements should be as accurate as possible. If you are testing plant growth, you might measure height with a ruler in centimeters. If you are testing how long ice takes to melt, you might measure time with a stopwatch in minutes and seconds. Choosing the right tool helps make the data useful.
Good investigations often use trials. A trial is one run of the test. If you test each condition only once, you might get an unusual result by chance. Repeating the investigation several times gives more dependable data. For example, if three paper towels absorb amounts of water measuring \(20\), \(22\), and \(21\) milliliters in three trials, you can see the results are close together. The average is \(\dfrac{20 + 22 + 21}{3} = \dfrac{63}{3} = 21\) milliliters.
Repeated trials also make it easier to find unusual results, called outliers. If one trial is very different from the others, it may mean there was an error, such as spilling water or measuring incorrectly. Scientists do not ignore data without a reason, but they do check whether something unexpected happened during the test.
Observations matter too. Not all data are numbers. You might note that one plant's leaves turned yellow, or that one ice cube cracked before melting. These details can help explain the results later. Good scientists write observations clearly and at the time they happen.
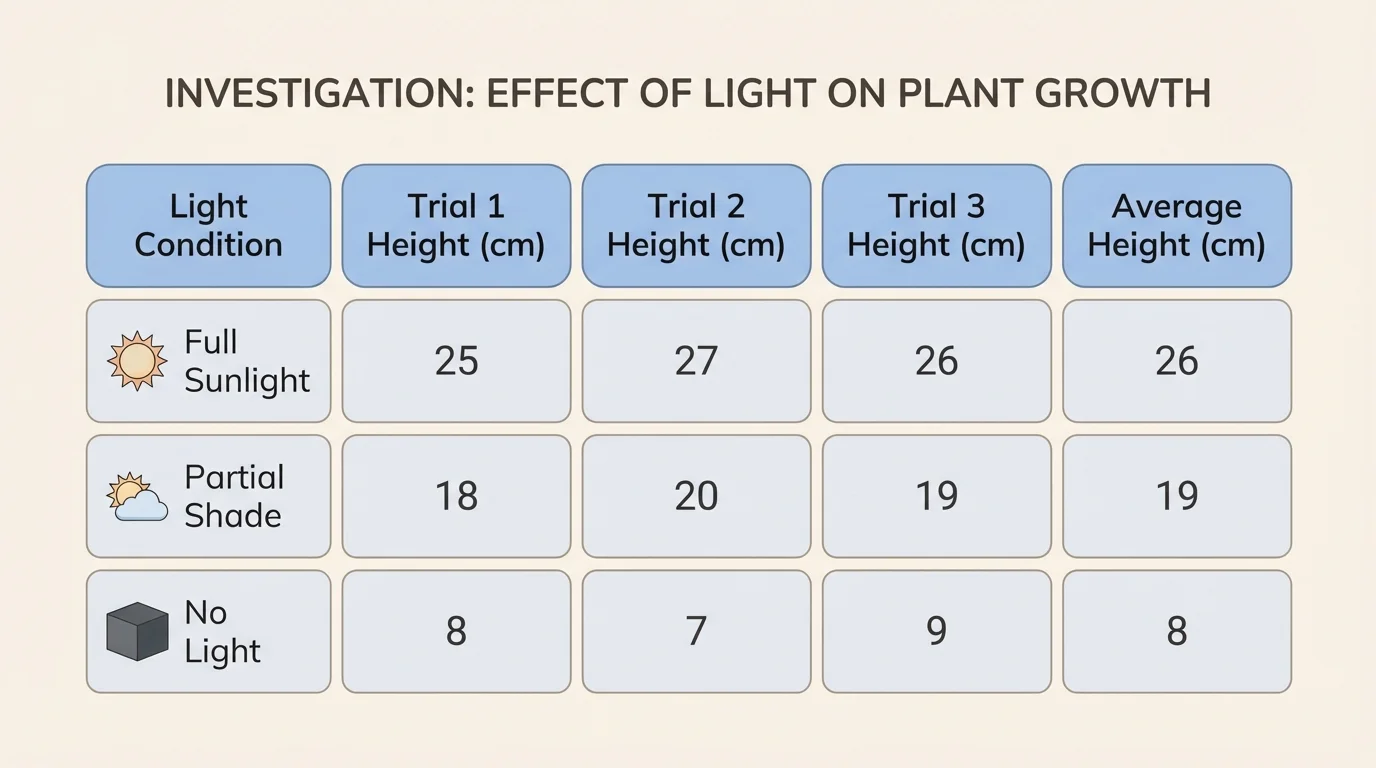
Example: Planning a plant investigation
A class wants to test whether the number of hours of light affects bean plant growth.
Step 1: Choose the independent variable
The class changes the number of light hours each day: \(4\) hours, \(8\) hours, and \(12\) hours.
Step 2: Choose the dependent variable
The class measures plant height in centimeters every two days.
Step 3: Control other variables
They use the same kind of bean seed, the same soil, the same amount of water, and the same size pot for every plant.
Step 4: Plan repeated trials
They grow \(3\) plants for each light condition instead of only \(1\). This provides more dependable data.
This design gives stronger evidence because it measures the same thing in a consistent way and repeats each condition.
Another part of planning is deciding how long the investigation should last. Some questions can be answered in minutes, such as how fast sugar dissolves. Others may need days or weeks, such as plant growth. The design must match the question.
Once the plan is ready, it is time to carry out the investigation. This step sounds simple, but it takes concentration. Even a good design can produce weak data if the procedure is not followed carefully. Scientists must measure consistently, record honestly, and avoid changing the method halfway through.
Safety comes first. If an investigation uses hot water, glass, electricity, or anything sharp, the procedure should include safe handling steps. Safety does not just protect people. It also protects the investigation, because accidents can damage equipment and ruin data.
Consistency is another key idea. If one group pours water quickly and another pours slowly, the results may not be comparable. If one student measures from the bottom of a cup and another from the top, the measurements may be off. A good investigation uses the same method every time.
Scientists also watch for sources of error. An error is something that can make the data less accurate. As [Figure 3] later illustrates, a ruler might be tilted, a stopwatch might be started late, or one plant might be placed near a fan. Errors do not always mean the whole investigation failed, but they must be considered when judging the evidence.
You already know that measuring tools have units, such as centimeters, grams, and seconds. In investigations, choosing the correct unit and using the tool in the same way each time are important for collecting reliable data.
Honest recording is essential. Scientists do not change numbers to fit what they hoped would happen. Real investigations sometimes give surprising results. Those results can still teach something important, especially when the data were collected carefully.
After collecting data, scientists look for patterns. They ask questions such as: Which condition had the highest value? Are the results close together across trials? Is there a trend? A table can help, and a graph can make differences easier to notice.
But the job is not just to read the data. Scientists must also evaluate the design. This means deciding whether the way the investigation was planned and carried out really produced data that can answer the question. A test might produce numbers, but not all numbers are useful evidence.
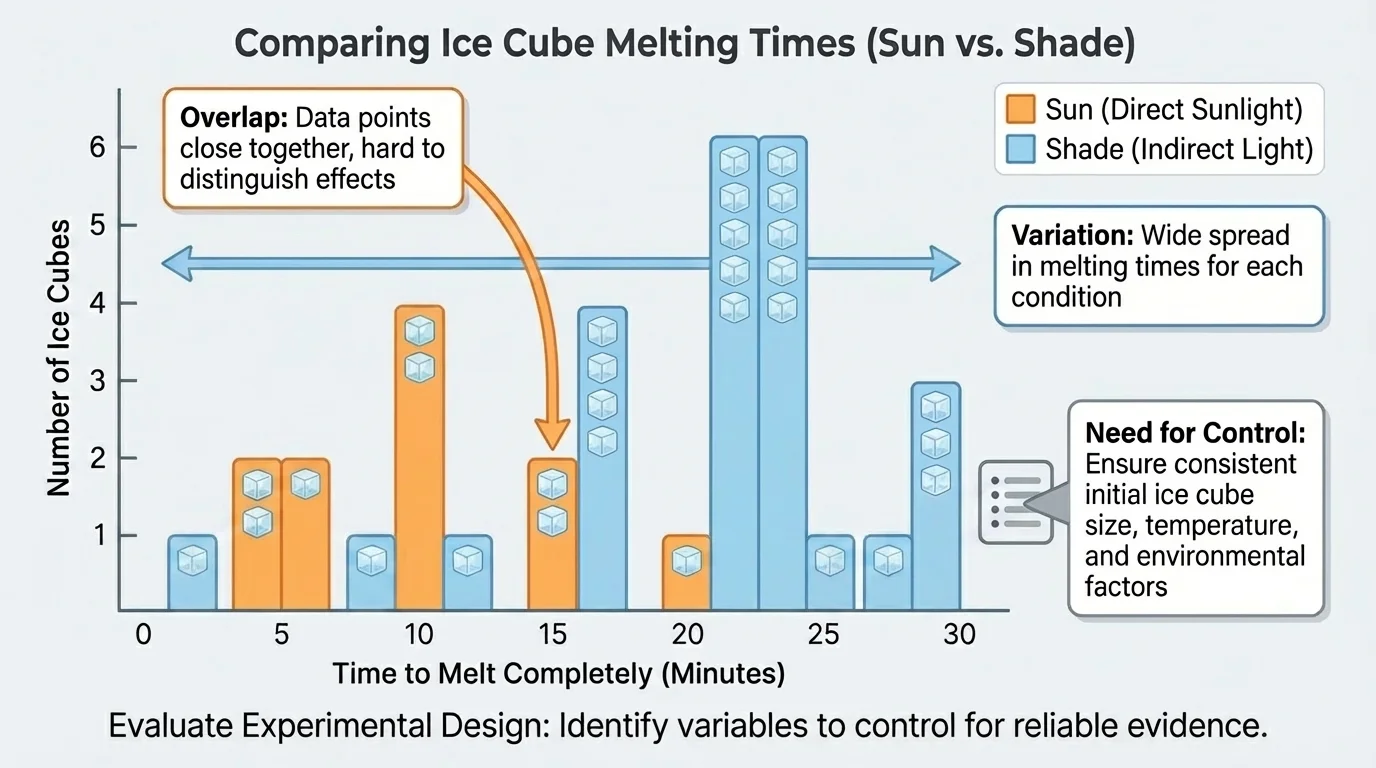
Suppose students tested how fast ice melts in sunlight and shade, but one ice cube was much larger than the others. The data might show the shaded ice lasted longer, but the design had a flaw because the cube sizes were not the same. The evidence is weaker because another factor may have caused the result.
Scientists ask several questions when they evaluate a design. Was the question clear? Was only one main variable changed? Were important variables controlled? Were there enough trials? Were measurements accurate? Was the procedure clear enough to repeat? If the answer to several of these questions is "no," then the conclusion may not be very strong.
Sometimes the design partly meets the goal. For example, the data may suggest a pattern, but there may not be enough trials to be sure. That does not mean the investigation was useless. It means the results should be treated carefully and the design should be improved.
As seen earlier in [Figure 2], repeated trials make it easier to judge whether a pattern is consistent. If one condition gives similar results across several trials, the evidence is stronger than if the results bounce up and down without a clear pattern.
Reliable evidence versus weak evidence
Reliable evidence comes from investigations that are fair, careful, and repeatable. Weak evidence may come from too few trials, poor measurements, changing too many variables at once, or unclear procedures. Evaluating design means asking whether the evidence is strong enough to support the conclusion.
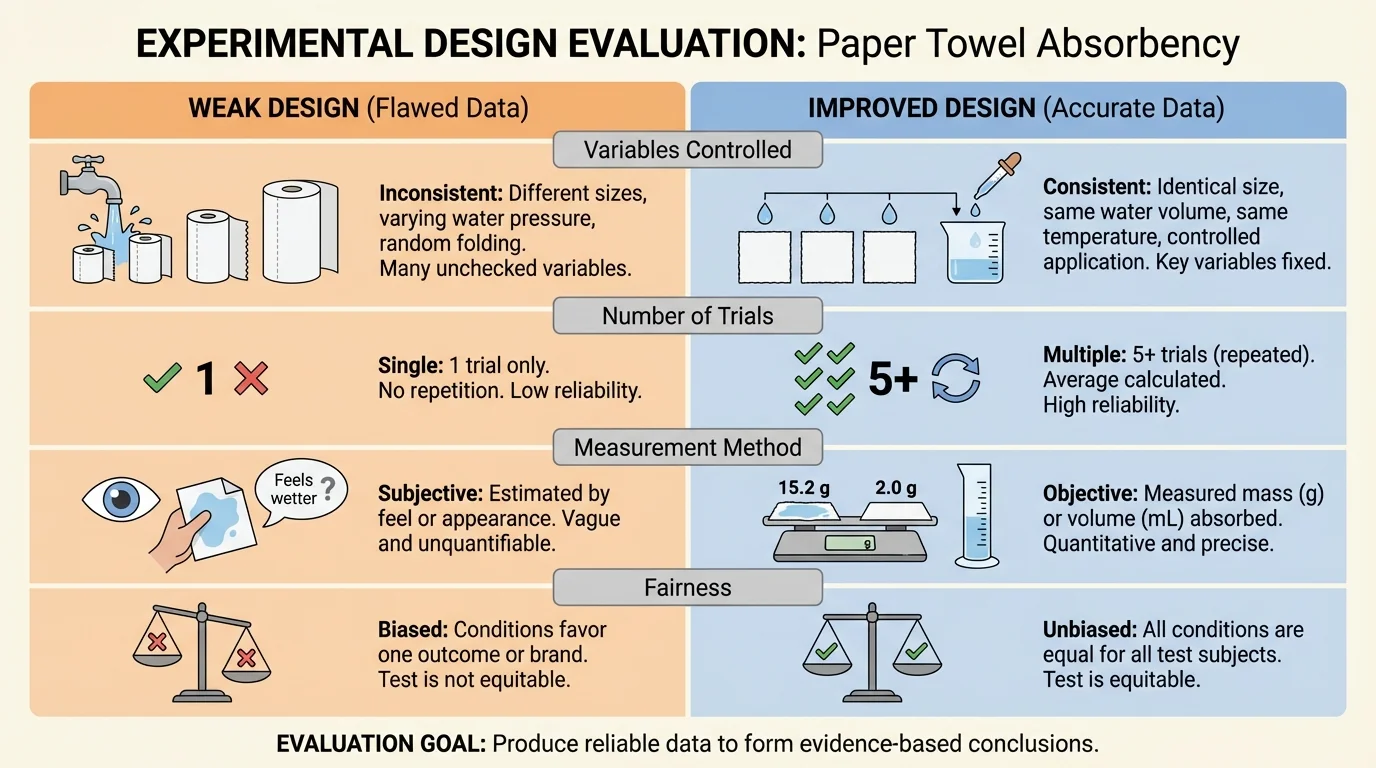
For grade-level investigations, students do not need perfect laboratory conditions. However, as [Figure 4] will help illustrate, they do need to think like scientists. They should look at what worked, what did not, and whether the data truly match the goal of the investigation.
Evaluating a design is useful because it helps scientists improve it. A better design does not just "look nicer." It removes confusion and gives clearer evidence. Improving the design may mean adding more trials, controlling more variables, using better tools, or writing clearer steps.
Consider a paper towel investigation. If students simply dip different paper towels into water for different lengths of time, the results are not fair. To improve the design, they could use pieces of equal size, dip each one for the same number of seconds, and measure how much water each holds after dripping for the same amount of time.
Another improvement is increasing the sample size. If only one bean plant is tested in each condition, a weak or unhealthy seed could change the results. If several plants are tested in each condition, the data are less likely to depend on one unusual plant.
Scientists may also redesign when they notice a hidden variable. A hidden variable is a factor that was not meant to change but actually did. For example, in a temperature test, cups with different colors might absorb heat differently. Changing to identical cups would improve the investigation.
Later, when students compare strong and weak designs, [Figure 4] helps show that improving one part of the investigation often improves the quality of the evidence. Better controls and clearer measurements make conclusions more dependable.
Example: Evaluating a melting ice investigation
Question: Does ice melt faster in sunlight than in shade?
Step 1: Look at the design
The class puts one ice cube in sunlight and one in shade.
Step 2: Find weaknesses
There is only \(1\) trial for each condition. The ice cubes may not be the same size. The trays under the cubes are different colors.
Step 3: Improve the design
Use equal-sized ice cubes, the same kind of tray, and at least \(3\) trials for sunlight and \(3\) trials for shade.
Step 4: Explain why it is better
The improved design gives more trustworthy data because it controls more variables and repeats the test.
This does not guarantee a perfect experiment, but it gives stronger evidence for answering the question.
Good science often involves revising and testing again. Investigations grow stronger when scientists learn from earlier designs.
Suppose students want to test which soil helps radish seeds sprout fastest. The independent variable is the soil type. The dependent variable could be the number of seeds that sprout after a set number of days. Controlled variables would include the number of seeds, the amount of water, the temperature, and the container size. If one soil group is placed in a warmer location than another, the evidence becomes unclear.
Another example is testing which ramp surface allows a toy car to roll farthest. The surface is changed on purpose. The distance traveled is measured. The car, ramp height, and starting point should stay the same. If students use different pushes, the design becomes unfair, because force changed too.
Students can also investigate absorbency, insulation, or evaporation. For example, if they compare which fabric keeps water warmest, they must begin with the same amount of water at the same starting temperature. If the starting temperatures are different, the data do not clearly answer the question.
"Science is a way of thinking much more than it is a body of knowledge."
— Carl Sagan
That idea fits investigations perfectly. Science is not just collecting facts. It is planning carefully, noticing details, and judging whether the evidence is strong enough.
Investigation skills are useful far beyond the classroom. Companies test bicycle helmets to see which designs protect best. Food scientists test how packaging keeps food fresh. City planners test materials for roads in different weather conditions. In each case, the design of the test must match the goal.
In sports, coaches may compare two training plans. To make the comparison fair, athletes should practice for the same amount of time and be measured in the same way. In farming, growers may test fertilizers, but they must keep water, soil, and sunlight as similar as possible. In medicine, researchers test treatments very carefully because people's health depends on strong evidence.
Even when you make a simple decision at home, investigation thinking can help. If you want to know which lunch container keeps an ice pack cold longest, you can plan a fair test, measure times carefully, repeat the trials, and evaluate whether your design really answered the question.
Conducting an investigation is really about building a path from a question to evidence. Evaluating the experimental design is how scientists check whether that path is strong, fair, and clear enough to trust.