You will learn:
Regression analysis is a way of relating variables to each other. Variables are simply the bits of information we have collected. By using regression analysis, we can find patterns in our data. It allows us to make predictions based on our data. Statistical Regression is a technique used to determine how a dependent variable, is affected by one or more independent variables. In mathematical terms Statistical Regression answers the question: What will be the impact on the value of Y (the dependent variable) if the value of X (the independent variable) is changed?
For example - we want to find out the relation between the age and price of used cars sold last year by a car dealer. We will see a negative relationship between these two variables. As the car age increases the prices go down. In this example, car age and car price are two variables. Car price is dependent on car age. What we want to find is an equation that best fits the data that we have. A very simple regression analysis model that we can use for our example is called the linear model, which uses a simple linear equation to fit the data. Linear equations when graphed give you a straight line.
Linear regression equation or also recognized as the slope formula has the form Y= a + bX, where Y is the dependent variable (that’s the variable that goes on the Y-axis), X is the independent variable (i.e. it is plotted on the X-axis), b is the slope of the line and a is the y-intercept(the value of y when x = 0).
The slope of a line is a value that describes the rate of change between the independent and dependent variables. The slope tells us how the dependent variable (y) changes for every one-unit increase in the independent (x) variable, on average. The y-intercept is used to describe the dependent variable when the independent variable equals zero.
b>0 shows a positive relationship between the two variables.
You can also use any statistical software like excel to get the equation for linear regression, to plot the scatter chart, and draw the regression line.
How does regression analysis work?
Linear regression consists of finding the best-fitting straight line through the points. Define a dependent variable that you hypothesize being influenced by one or several independent variables. Collect the dataset for these variables.
Example 1: Let's consider the below data for the used car sale.
| Car Age (in years) | Price (in dollars) |
| 4 | 6500 |
| 4 | 6000 |
| 5 | 5500 |
| 5 | 5300 |
| 7 | 4700 |
| 7 | 4300 |
| 8 | 4000 |
| 9 | 3100 |
| 10 | 3000 |
| 11 | 2000 |
| 12 | 1800 |
Looking at the data we can say that car price reduces with the increase in car age.
The formula for a regression line is Y= a + bX, derive a and b using below formulas
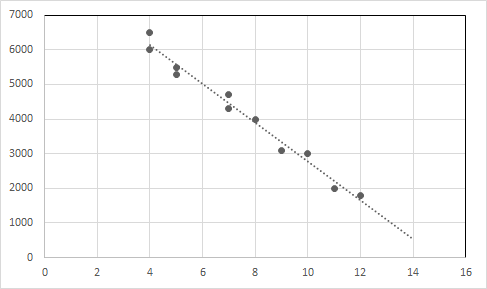
The linear regression equation for this relationship is Y = -557.62125X + 8356.81293
Plot the data points and the regression line in a graph.
X-axis : Age, Y-axis : Price
Example2: John is a plumber. He charges $25 dollars as visiting charge and $35 as his hourly working charges. A linear equation that expresses the total amount of money John earns for each visit is y = 25 + 35x.
Why the regression analysis?